Effective topical treatment of subcutaneous murine B16F10-Nex2 melanoma by the antimicrobial peptide gomesin - PubMed (original) (raw)
Effective topical treatment of subcutaneous murine B16F10-Nex2 melanoma by the antimicrobial peptide gomesin
Elaine G Rodrigues et al. Neoplasia. 2008 Jan.
Abstract
Gomesin is a potent antimicrobial peptide (AMP) isolated from hemocytes of the spider Acanthoscurria gomesiana. The present study aimed at determining whether gomesin exerted antitumor activity in vitro and in vivo. Topical treatment of subcutaneous murine melanoma with gomesin incorporated in a cream base significantly delayed tumor growth. A direct cytotoxicity of gomesin in murine melanoma B16F10-Nex2 cells and several human tumor cell lineages was observed in vitro, with IC(50) values below 5 microM. The beta-hairpin structure of gomesin with disulfide bridges seemed essential for optimal activity. d-Gomesin was equally active. A membrane-permeabilizing activity was suggested, as gomesin bound to the cell membrane and cytoplasmic lactate dehydrogenase was detected extracellularly. At doses causing partial growth of tumor cells, gomesin allowed internalization of macromolecules (immunoglobulins), which increased the cytotoxic effect. The in vivo antitumor effect of gomesin might also involve a cytotoxic effect on endothelial cells because cultured human endothelial cells were killed in vitro at a similar concentration range. This effect represents a novel and potential use for gomesin as a topical agent against unsuccessfully treated intradermal and epithelial skin cancers. To our knowledge, this is the first report on the successful topical use of AMPs in cancer treatment.
Figures
Figure 1
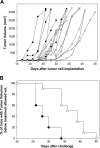
Topical treatment with a gomesin-containing cream delayed subcutaneous tumor development and increased the time of living animals with tumors below the maximum allowed size. B16F10-Nex2 murine melanoma cells (105 per animal) were injected subcutaneously into the hair-free flank of C57BL/6 male mice. Animals were treated topically with a _Gm_-containing cream (white circles, n = 10) or a control cream (black circles, n = 5), as described in Materials and Methods. (A) Individual tumor volumes. (B) Treated and control mice bearing tumors bellow 3000 mm3 after different times of tumor implantation. Log rank test, P < .01.
Figure 2
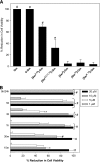
The antimicrobial peptide gomesin showed in vitro cytotoxic effect on B16F10-Nex2 murine tumor cells, in a dose-, time-, and structure-dependent fashion. (A) Tumor cells were incubated for 12 hours with 20 µM gomesin (Gm), its
d
-enantiomer (
d
-Gm), monocyclic {[Ser2,15]-Gm}, linear {[Ser2,6,11,15]-Gm}, forms, and with 10 µM analogues with amino acid substitutions disrupting the hydrophobic face of the peptide, [Ser5]-Gm, [Ser12]-Gm, and [Ser5,12]-Gm. (B) Cells were incubated with different concentrations of Gm (1, 5, 10, and 20 µM) for 15 minutes up to 5 hours. Cells were alternatively incubated with Gm for 5 hours, washed to eliminate the peptide, and incubated with fresh medium for 24 hours (5/24 h). Cell viability was determined by counting cells in presence of Trypan blue. Data are a representative experiment of a triplicate set. Bars represent means and standard deviations (SD). *P < .05 and #P < .01 relative to the control.
Figure 3
Gomesin accumulated on the cell membrane and permeabilized B16F10-Nex2 tumor cells. Cells were cultivated on round glass coverslips, treated with 5 µM Gm for 10 minutes, fixed, and incubated with anti-Gm polyclonal monospecific antibody (B), or murine antitubulin antibody (C), both revealed with FITC-conjugated secondary antibodies (green). The fluorescence was analyzed by confocal microscopy as described in Materials and Methods. Red, phalloidin-rhodamine; blue, DAPI staining. (A) Single optical section through control cells treated with phalloidin-rhodamine, DAPI, and antitubulin in the absence of Gm; (B, C) maximum pixel value projections of serial optical sections. Scale bars, 20 µm.
Figure 4
Gomesin treatment of B16F10-Nex2 cells in vitro induced leakage of cytoplasmic LDH. Cells were incubated with 5, 10, or 20 µM Gm for 5, 15, and 30 minutes, and the activity of LDH in the culture supernatants was quantified by NADH consumption, as described in Materials and Methods. Control, untreated cells; Triton, cells treated with 10% of Triton X-100 for maximal lysis of tumor cells. Data are a representative experiment of a triplicate set. Bars represent means and SD. *P < .01 compared to respective control.
Figure 5
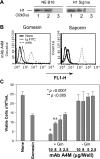
Immunoglobulins (IgM) were detected in the cytoplasm of B16F10-Nex2 murine melanoma cells permeabilized with a low dose of gomesin. (A) Chemiluminescent immunoblot analysis showing mAb A4M reactivity with histone 1. NE B16, nuclear extract of B16F10-Nex2 cells; H1 Sigma, commercially purified calf thymus histone from Sigma. Lane 1, 25 µg/ml mAb A4M; Lane 2, 25 µg/ml commercial anti-pan histone antibody; Lane 3, 25 µg/ml an irrelevant mAb. (B) Cells were incubated with a low dose of Gm (2 µM) or with 0.5% saponin and 100 µg/ml mAb A4M for 12 hours. Samples were incubated with FITC-conjugated secondary antibodies and cytoplasmic fluorescence was quantified by FACS. None, untreated cells; Ig-FITC, cells treated with secondary antibodies in the absence of mAbs; FL1-H, fluorescence intensity. (C) Cells were incubated with different concentrations of A4M mAb (25, 50, 80, and 100 µg/ml) in presence (+Gm) or absence (-Gm) of 2 µM Gm for 12 hours. Viable cells were counted in the presence of Trypan blue. None, untreated cells; Gomesin, cells treated with 2 µM Gm. Data are a representative experiment of a triplicate set. Bars represent means and SD.
Figure 6
Morphologic alterations of B16F10-Nex2 cells induced by gomesin and the association of gomesin and mAb A4M analyzed by light microscopy. Cells were either (A) left untreated or treated with (B) 2 µM Gm for 120 minutes, (C) 100 µg/ml mAb A4M for 120 minutes, (D) 15 µM Gm for 30 minutes, and 2 µ Gm associated with 100 µg/ml mAb A4M for either (E) 10 or (F) 15 minutes. A picture was taken every 5 minutes, and those at representative times are depicted (original magnification, x40).
Figure 7
Extracellular acidification response of B16F10-Nex2 cells to gomesin and cisplatin. Cells were added to Transwell cups and placed on the Cytosensor Microphysiometer. After 20 minutes of equilibration in low buffered RPMI-1% BSA, gomesin (10 µM) and cisplatin (200 µM), diluted in the same medium, were added at zero time and maintained during the whole experiment (400 minutes). The cells were monitored for acidification rate every 2 minutes, in relation to untreated control cells.
Similar articles
- Characterization of thimet oligopeptidase and neurolysin activities in B16F10-Nex2 tumor cells and their involvement in angiogenesis and tumor growth.
Paschoalin T, Carmona AK, Rodrigues EG, Oliveira V, Monteiro HP, Juliano MA, Juliano L, Travassos LR. Paschoalin T, et al. Mol Cancer. 2007 Jul 9;6:44. doi: 10.1186/1476-4598-6-44. Mol Cancer. 2007. PMID: 17620116 Free PMC article. - Redesigned Spider Peptide with Improved Antimicrobial and Anticancer Properties.
Troeira Henriques S, Lawrence N, Chaousis S, Ravipati AS, Cheneval O, Benfield AH, Elliott AG, Kavanagh AM, Cooper MA, Chan LY, Huang YH, Craik DJ. Troeira Henriques S, et al. ACS Chem Biol. 2017 Sep 15;12(9):2324-2334. doi: 10.1021/acschembio.7b00459. Epub 2017 Aug 8. ACS Chem Biol. 2017. PMID: 28741926 - Structure-activity relationship studies of gomesin: importance of the disulfide bridges for conformation, bioactivities, and serum stability.
Fázio MA, Oliveira VX Jr, Bulet P, Miranda MT, Daffre S, Miranda A. Fázio MA, et al. Biopolymers. 2006;84(2):205-18. doi: 10.1002/bip.20396. Biopolymers. 2006. PMID: 16235231 - Unlocking the Potential of the Antimicrobial Peptide Gomesin: From Discovery and Structure-Activity Relationships to Therapeutic Applications.
Liu X, Henriques ST, Craik DJ, Chan LY. Liu X, et al. Int J Mol Sci. 2023 Mar 20;24(6):5893. doi: 10.3390/ijms24065893. Int J Mol Sci. 2023. PMID: 36982972 Free PMC article. Review. - The Biological and Biophysical Properties of the Spider Peptide Gomesin.
Tanner JD, Deplazes E, Mancera RL. Tanner JD, et al. Molecules. 2018 Jul 16;23(7):1733. doi: 10.3390/molecules23071733. Molecules. 2018. PMID: 30012962 Free PMC article. Review.
Cited by
- Therapeutic vaccination against a murine lymphoma by intratumoral injection of a cationic anticancer peptide.
Berge G, Eliassen LT, Camilio KA, Bartnes K, Sveinbjørnsson B, Rekdal O. Berge G, et al. Cancer Immunol Immunother. 2010 Aug;59(8):1285-94. doi: 10.1007/s00262-010-0857-6. Epub 2010 Apr 27. Cancer Immunol Immunother. 2010. PMID: 20422410 Free PMC article. - Gomesin peptides prevent proliferation and lead to the cell death of devil facial tumour disease cells.
Fernandez-Rojo MA, Deplazes E, Pineda SS, Brust A, Marth T, Wilhelm P, Martel N, Ramm GA, Mancera RL, Alewood PF, Woods GM, Belov K, Miles JJ, King GF, Ikonomopoulou MP. Fernandez-Rojo MA, et al. Cell Death Discov. 2018 Feb 14;4:19. doi: 10.1038/s41420-018-0030-0. eCollection 2018 Dec. Cell Death Discov. 2018. PMID: 29531816 Free PMC article. - From antimicrobial to anticancer peptides. A review.
Gaspar D, Veiga AS, Castanho MA. Gaspar D, et al. Front Microbiol. 2013 Oct 1;4:294. doi: 10.3389/fmicb.2013.00294. Front Microbiol. 2013. PMID: 24101917 Free PMC article. Review. - Anticancer, antimicrobial, and analgesic activities of spider venoms.
Akef HM. Akef HM. Toxicol Res (Camb). 2018 Mar 8;7(3):381-395. doi: 10.1039/c8tx00022k. eCollection 2018 May 8. Toxicol Res (Camb). 2018. PMID: 30090588 Free PMC article. Review. - Insect antimicrobial peptides: potential tools for the prevention of skin cancer.
Tonk M, Vilcinskas A, Rahnamaeian M. Tonk M, et al. Appl Microbiol Biotechnol. 2016 Sep;100(17):7397-405. doi: 10.1007/s00253-016-7718-y. Epub 2016 Jul 15. Appl Microbiol Biotechnol. 2016. PMID: 27418360 Free PMC article. Review.
References
- Naumov GN, Townson JL, MacDonald IC, Wilson SM, Bramwell VH, Groom AC, Chambers AF. Ineffectiveness of doxorubicin treatment on solitary dormant mammary carcinoma cells or late-developing metastases. Breast Cancer Res Treat. 2003;82:199–206. - PubMed
- Gottesman MM. Mechanisms of cancer drug resistance. Ann Rev Med. 2002;53:615–627. - PubMed
- Gottesman MM, Ling V. The molecular basis of multidrug resistance in cancer: the early years of P-glycoprotein research. FEBS Lett. 2006;580:998–1009. - PubMed
- Folkman J. Angiogenesis. Ann Rev Med. 2006;57:1–18. - PubMed
- Ferrara N, Kerbel RS. Angiogenesis as a therapeutic target. Nature. 2005;438:967–974. - PubMed
Publication types
MeSH terms
Substances
LinkOut - more resources
Full Text Sources
Medical


