Renal dendritic cells stimulate IL-10 production and attenuate nephrotoxic nephritis - PubMed (original) (raw)
Renal dendritic cells stimulate IL-10 production and attenuate nephrotoxic nephritis
Juliane Scholz et al. J Am Soc Nephrol. 2008 Mar.
Abstract
The role of renal dendritic cells (DCs) in glomerulonephritis is unknown. This question was addressed in nephrotoxic nephritis, a murine model of human necrotizing glomerulonephritis, which is dependent on CD4(+) Th1 cells and macrophages. DCs in nephritic kidneys showed signs of activation, accumulated in the tubulo-interstitium, and infiltrated the periglomerular space surrounding inflamed glomeruli. In ex vivo coculture experiments with antigen-specific CD4(+) T cells, DCs stimulated the secretion of IL-10, which is known to attenuate nephrotoxic nephritis, and the Th1 cytokine IFNgamma. Endogenous renal CD4(+) T cells produced both of these cytokines as well, but those from nephritic mice secreted increased amounts of IL-10. Renal DCs were found to express ICOS-L, an inducer of IL-10. To evaluate the in vivo role of renal DCs in disease, CD11c(+) DCs were depleted on days 4 and 10 after the induction of nephritis by injecting CD11c-DTR/GFP mice with diphtheria toxin. Sparing DCs until day 4 did not affect the autologous phase of nephritis. The number of renal DCs was reduced by 70% to 80%, the number of renal macrophages was unchanged, and periglomerular infiltrates were eliminated. On days 11 to 14, we observed aggravated tubulointerstitial and glomerular damage, reduced creatinine clearance, and increased proteinuria. These findings demonstrate that renal DCs exert a renoprotective effect in nephrotoxic nephritis, possibly by expressing ICOS-L and/or by inducing IL-10 in infiltrating CD4(+) Th1 cells.
Figures
Figure 1.
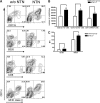
Conventional DCs accumulate and mature in nephritic kidneys. (A) On day 7 after induction of NTN, DCs were isolated from the kidneys of nephritic mice (NTN) or non-nephritic controls (without NTN) and analyzed by flow cytometry for expression of DC subtype markers. Contour plots show representative expression profiles of the DC marker, CD11c, versus CD11b, CD8α, B220, and MHC II. (B) Gives statistical analysis of the numbers of DCs bearing these subtypes markers from the experiment shown in panel A (NTN, black bars; non-nephritic controls: white bars, n = 4). (C) MHC II and CD80 mean fluorescence intensities (MFI) detected on CD11c+ cells from the kidneys of nephritic (black bars) and non-nephritic (white bars) mice. These results are representative for 3 individual experiments. *P < 0.05; **P < 0.01.
Figure 2.
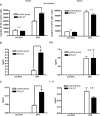
DCs from nephritic kidneys activate CD4+ T cells and induce IFNγ and IL-10 production. DCs from the kidneys (left graphs) or spleens (right graphs) of nephritic mice (black bars) or non-nephritic controls (white bars) were isolated, cultured with 1 mg/ml OVA or without OVA (without OVA) for 2 h, washed, and were subsequently co-incubated with 1 × 10⁵ OT-II cells. After 3 d, the number of viable OT-II cells was determined by flow cytometry (A), and the concentrations of IFNγ (B) and IL-10 (C) in the culture supernatants by ELISA. Shown are results typical of 4 independent experiments in groups of 3 or 4 mice. n.s, not significant (P ≥ 0.05); *P < 0.05.
Figure 3.
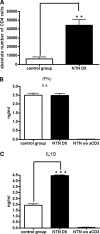
Endogenous CD4+ T cells produce IL-10 and IFNγ in NTN. (A) On day 5 after induction of NTN, kidneys from nephritic mice and non-nephritis controls were taken and CD4+ T cell numbers were determined. (B and C) 1 × 10⁵ CD4+ T cells described in 3A were cultured in anti-CD3-coated 96 well-plates. After 40 h, IFNγ (B) and IL-10 (C) concentrations were determined by ELISA. Shown are results typical for 3 individual experiments. wo aCD3, without anti-CD3 antibody stimulation. n.s, not significant (P ≥ 0.05); **P < 0.01; ***P < 0.001.
Figure 4.
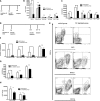
Efficiency and specificity of DC depletion in the kidney. (A) Experimental protocol to determine specificity of DC depletion. Four days after induction of NTN in CD11c-DTR/GFP mice (black columns) or wild-type controls (white columns), all mice were injected intraperitoneally with 4 ng DT per g body weight. (B and C) On day 5, kidney (B) or spleen (C) single-cell suspensions were analyzed by flow cytometry for total numbers of CD11c+ DCs, CD11c− CD11b+ macrophages, CD4+ and CD8+ T cells, and for NK cells per organ. (D) Protocol to determine the effect of DC depletion on NTN. Four and 10 days after induction of NTN in CD11c-DTR/GFP mice (black columns) or wild-type controls (white columns), mice received 4 ng DT per g body weight. (E) On day 14, kidney single-cell suspensions were analyzed by flow cytometry for CD11c+ cells, GFP+ cells, and for co-expression of CD11b and MHC II. Contour plots show representative expression profiles of these markers. (F and G) Statistical analysis of the total numbers of intrarenal CD11c+ DCs, CD11c+ DCs expressing transgenic GFP, MHC II+ DCs, and CD11c− CD11b+ macrophages (F), and of CD4+ T cells, CD8+ T cells and CD19+ B cells (G) on day 14. (H) Numbers of splenic CD11c+ DCs, CD4+ T cells on day 14. These results are representative for 2 individual experiments using groups of 4 mice. n.s, not significant (P ≥ 0.05); *P < 0.05; **P < 0.01.
Figure 5.
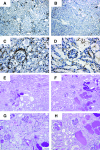
Histologic images. Kidney sections from DT-injected CD11c-DTR/GFP mice (B, D, F, H) and controls (A, C, E, G) from the protocol shown in Figure 4D (using 4 mg sheep Ig/g body weight) were taken on day 11 and stained for MHC II (A-D) or by PAS (E-F). A, B, E, and F: original magnification ×100; C, D, G, and H: original magnification ×200. Shown are representative sections illustrating the quantitative analyses shown in Figure 7, A through D.
Figure 6.
Systemic immunity against sheep Ig is not affected by DC depletion. (A) Serum samples from DT-injected CD11c-DTR/GFP mice (black bars) and controls (white bars) from the experimental protocol shown in Figure 4D were taken on day 14 and analyzed by ELISA for titers of total murine IgG, IgG1, and IgG2a levels specific for sheep IgG (mouse IgG/IgG1/IgG2a α sheep IgG). (B) 2 × 10⁵ splenocytes from the same mice were cocultured with 10 μg/ml sheep Ig. After 3 d, concentrations of IL-10 and TNFα and, in separate experiments, of IL-2 and IFNγ, in the culture supernatant were determined by ELISA. n.s, not significant.
Figure 7.
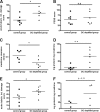
Depletion of DCs aggravates kidney damage in NTN. (A-D) Groups of 6 to 8 CD11c-DTR/GFP mice (squares) or nontransgenic controls (triangles) that had received 2.5 mg nephritogenic sheep Ig/g body weight were injected with DT as shown in the protocol in Figure 4D. On day 10, mice were placed in metabolic cages and 24 h urine was collected for determining urinary protein excretion per creatinine (D and F). On the following day, kidneys were taken for histologic analysis of the acute tubulointerstitial damage (A) and the focal segmental glomerulosclerosis scores (B) and serum samples for calculating creatinine clearance (C). These results are representative for 4 of 5 experiments in groups of 3 to 4 mice. In the fifth experiment, differences were not statistically significant. (E and F) In 2 separate experiments depicted by open or closed symbols, mice received only 2.0 mg nephritogenic sheep Ig/g body weight, and histologic (E) and urine analysis (F) was performed on day 14. n.s, not significant (P ≥ 0.05); *P < 0.05; **P < 0.01.
Figure 8.
Immunological mechanisms with protective potential in NTN. (A and B) DT was injected intraperitoneally on day 4 after induction of NTN in groups of 3 to 4 CD11c-DTR/GFP mice (black columns) or wild-type controls (white columns). On day 5, spleen (A) or kidney (B) single-cell suspensions were analyzed by flow cytometry for total numbers of CD4+ CD25+ and CD4+ CD25+ FoxP3+ Treg. (C and D) CD11c+ DCs from the spleens (C) or kidneys (D) of day 5 nephritic mice (dashed line) or non-nephritic controls (gray areas, “without NTN”) were analyzed by flow cytometry for ICOS-L expression. n.s, not significant (P ≥ 0.05).
Similar articles
- Kidney Dendritic Cells Become Pathogenic during Crescentic Glomerulonephritis with Proteinuria.
Hochheiser K, Engel DR, Hammerich L, Heymann F, Knolle PA, Panzer U, Kurts C. Hochheiser K, et al. J Am Soc Nephrol. 2011 Feb;22(2):306-16. doi: 10.1681/ASN.2010050548. Epub 2010 Dec 16. J Am Soc Nephrol. 2011. PMID: 21164025 Free PMC article. - Activation of toll-like receptor-7 exacerbates lupus nephritis by modulating regulatory T cells.
Gong L, Wang Y, Zhou L, Bai X, Wu S, Zhu F, Zhu YF. Gong L, et al. Am J Nephrol. 2014;40(4):325-44. doi: 10.1159/000368204. Epub 2014 Oct 21. Am J Nephrol. 2014. PMID: 25341693 - Opposing Roles of Dendritic Cell Subsets in Experimental GN.
Brähler S, Zinselmeyer BH, Raju S, Nitschke M, Suleiman H, Saunders BT, Johnson MW, Böhner AMC, Viehmann SF, Theisen DJ, Kretzer NM, Briseño CG, Zaitsev K, Ornatsky O, Chang Q, Carrero JA, Kopp JB, Artyomov MN, Kurts C, Murphy KM, Miner JH, Shaw AS. Brähler S, et al. J Am Soc Nephrol. 2018 Jan;29(1):138-154. doi: 10.1681/ASN.2017030270. Epub 2017 Dec 7. J Am Soc Nephrol. 2018. PMID: 29217759 Free PMC article. - Glomerular accumulation of plasmacytoid dendritic cells in active lupus nephritis: role of interleukin-18.
Tucci M, Quatraro C, Lombardi L, Pellegrino C, Dammacco F, Silvestris F. Tucci M, et al. Arthritis Rheum. 2008 Jan;58(1):251-62. doi: 10.1002/art.23186. Arthritis Rheum. 2008. PMID: 18163476 - T cell cross-talk with kidney dendritic cells in glomerulonephritis.
Panzer U, Kurts C. Panzer U, et al. J Mol Med (Berl). 2010 Jan;88(1):19-26. doi: 10.1007/s00109-009-0541-5. Epub 2009 Oct 2. J Mol Med (Berl). 2010. PMID: 19798477 Review.
Cited by
- CD103+ Kidney Dendritic Cells Protect against Crescentic GN by Maintaining IL-10-Producing Regulatory T Cells.
Evers BD, Engel DR, Böhner AM, Tittel AP, Krause TA, Heuser C, Garbi N, Kastenmüller W, Mack M, Tiegs G, Panzer U, Boor P, Ludwig-Portugall I, Kurts C. Evers BD, et al. J Am Soc Nephrol. 2016 Nov;27(11):3368-3382. doi: 10.1681/ASN.2015080873. Epub 2016 Apr 1. J Am Soc Nephrol. 2016. PMID: 27036736 Free PMC article. - Functionally relevant neutrophilia in CD11c diphtheria toxin receptor transgenic mice.
Tittel AP, Heuser C, Ohliger C, Llanto C, Yona S, Hämmerling GJ, Engel DR, Garbi N, Kurts C. Tittel AP, et al. Nat Methods. 2012 Feb 26;9(4):385-90. doi: 10.1038/nmeth.1905. Nat Methods. 2012. PMID: 22367054 - Immature renal dendritic cells recruit regulatory CXCR6(+) invariant natural killer T cells to attenuate crescentic GN.
Riedel JH, Paust HJ, Turner JE, Tittel AP, Krebs C, Disteldorf E, Wegscheid C, Tiegs G, Velden J, Mittrücker HW, Garbi N, Stahl RA, Steinmetz OM, Kurts C, Panzer U. Riedel JH, et al. J Am Soc Nephrol. 2012 Dec;23(12):1987-2000. doi: 10.1681/ASN.2012040394. Epub 2012 Nov 8. J Am Soc Nephrol. 2012. PMID: 23138484 Free PMC article. - Natural recovery from antiglomerular basement membrane glomerulonephritis is associated with glomeruli-infiltrating CD8α+CD11c+MHC class II+ cells.
Zhou C, Robertson J, Wu J, Bartkowiak T, Parker K, McMahon J, Lou YH. Zhou C, et al. Am J Nephrol. 2011;34(6):519-28. doi: 10.1159/000333004. Epub 2011 Nov 7. Am J Nephrol. 2011. PMID: 22068125 Free PMC article. - Human renal cell carcinoma induces a dendritic cell subset that uses T-cell crosstalk for tumor-permissive milieu alterations.
Figel AM, Brech D, Prinz PU, Lettenmeyer UK, Eckl J, Turqueti-Neves A, Mysliwietz J, Anz D, Rieth N, Muenchmeier N, Buchner A, Porubsky S, Siegert SI, Segerer S, Nelson PJ, Noessner E. Figel AM, et al. Am J Pathol. 2011 Jul;179(1):436-51. doi: 10.1016/j.ajpath.2011.03.011. Epub 2011 May 18. Am J Pathol. 2011. PMID: 21703422 Free PMC article.
References
- Tipping PG, Holdsworth SR: T cells in crescentic glomerulonephritis. J Am Soc Nephrol 17: 1253–1263, 2006 - PubMed
- Rodriguez-Iturbe B, Pons H, Herrera-Acosta J, Johnson RJ: Role of immunocompetent cells in nonimmune renal diseases. Kidney Int 59: 1626–1640, 2001 - PubMed
- Lang A, Benke D, Eitner F, Engel D, Ehrlich S, Breloer M, Hamilton-Williams E, Specht S, Hoerauf A, Floege J, von Bonin A, Kurts C: Heat shock protein 60 is released in immune-mediated glomerulonephritis and aggravates disease: in vivo evidence for an immunologic danger signal. J Am Soc Nephrol 16: 383–391, 2005 - PubMed
- Kitching AR, Holdsworth SR, Tipping PG: IFN-gamma mediates crescent formation and cell-mediated immune injury in murine glomerulonephritis. J Am Soc Nephrol 10: 752–759, 1999 - PubMed
- Timoshanko JR, Holdsworth SR, Kitching AR, Tipping PG: IFN-gamma production by intrinsic renal cells and bone marrow-derived cells is required for full expression of crescentic glomerulonephritis in mice. J Immunol 168: 4135–4141, 2002 - PubMed
Publication types
MeSH terms
Substances
LinkOut - more resources
Full Text Sources
Other Literature Sources
Molecular Biology Databases
Research Materials
Miscellaneous
