High-resolution mapping and characterization of open chromatin across the genome - PubMed (original) (raw)
High-resolution mapping and characterization of open chromatin across the genome
Alan P Boyle et al. Cell. 2008.
Abstract
Mapping DNase I hypersensitive (HS) sites is an accurate method of identifying the location of genetic regulatory elements, including promoters, enhancers, silencers, insulators, and locus control regions. We employed high-throughput sequencing and whole-genome tiled array strategies to identify DNase I HS sites within human primary CD4+ T cells. Combining these two technologies, we have created a comprehensive and accurate genome-wide open chromatin map. Surprisingly, only 16%-21% of the identified 94,925 DNase I HS sites are found in promoters or first exons of known genes, but nearly half of the most open sites are in these regions. In conjunction with expression, motif, and chromatin immunoprecipitation data, we find evidence of cell-type-specific characteristics, including the ability to identify transcription start sites and locations of different chromatin marks utilized in these cells. In addition, and unexpectedly, our analyses have uncovered detailed features of nucleosome structure.
Figures
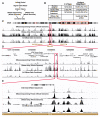
Figure 1. DNase-Chip and DNase-Seq Identify DNase I Hypersensitive Sites on a Whole-Genome Scale
(A) Each method begins with the digestion of intact nuclei with DNase I followed by the attachment of linkers. Each technology is then used to independently identify DNase I HS sites. Finally, the data are combined into a comprehensive, high-resolution and low-noise map of HS sites on a genome-wide scale. (B) Number of sequence tags generated using Illumina and 454 technologies, as well as probes for whole-genome DNase-chip studies. (C) UCSC genome browser view of the q arm of chromosome 5 showing a large-scale view of each technology along with the combined set. (D) Browser view of ENCODE region ENm002. (E) Browser view of the DNase I HS sites around the IRF1 gene. Each of these views shows the high correlation between the peak size and location for both the sequencing and chip technologies.
Figure 2. Each Individual Technology Is Highly Correlated with the Entire Spectrum of qPCR Values
(A) DNase-seq data are correlated with qPCR with Spearman’s ρ = 0.744. (B) DNase-Chip is correlated with qPCR with ρ = 0.812. (C) The combined DNase-seq/DNase-chip dataset is even more correlated with qPCR with ρ = 0.874. (D) Receiver Operating Characteristic (ROC) curves showing sensitivity and specificity. DNase-seq has an area under the curve (AUC) of 0.937, DNase-Chip has an AUC of 0.956, and the combined dataset has an AUC of 0.971. A perfect discriminator would have an AUC of 1, while a random test would have an AUC of 0.5 (dashed line). (E) Heat map showing the range of qPCR experiments (n = 608) with yellow showing true DNase I HS and blue showing DNase resistant sites. Note that in some cases both DNase-Chip and DNase-seq agree on a qPCR negative call, indicating that this site may in fact be hypersensitive.
Figure 3. Location of DNase I Hypersensitive Sites Relative to Annotated Genes
(A) The locations of DNase I hypersensitive (DHS) sites relative to gene annotations. Shown are the locations of all DNase I HS sites, the strongest scoring DNase I HS sites (top 20%), and the weakest scoring DNase I HS sites (bottom 20%). (B) Genes that have high expression (>9) are likely to have a DNase I HS site at the 5′ end, while genes lacking a 5′ DNase I HS site are more likely to have low expression. (C) GO categories and probabilities related to genes that are lacking 5′ DNase I HS sites.
Figure 4. TSS and ChIP-Seq Data Related to the Strongest Portion of Each DNase I HS Site
(A) Transcription start site for annotated genes in UCSC Genome Browser Known Genes track are on average 85 bp downstream from the DNase I HS sites. (B) RNA Polymerase II ChIP-seq data are enriched on average 123 bp downstream from DNase I HS sites. (C) CTCF ChIP-seq data are enriched for a peak slightly upstream of the DNase I HS sites. TSS, Pol II, and CTCF datasets are divided into four groups based on expression level (high, medium, low, and silent). (D) Histone modifications and H2A.Z are enriched for the DNase I HS sites that are near highly expressed genes. A trough for each histone modification and H2A.Z directly overlaps the strongest portion of each DNase I HS site, and not TSS (thick dotted line) or Pol II (thin dotted line). Note that for ease of comparison, H3K4me3 normalized counts were halved.
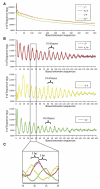
Figure 5. Ultra-High-Resolution View of Chromatin Structure
(A) A clear oscillation pattern is visible for sites < 150 bp apart. (B) A 10.4 base pair oscillation frequency is observed only in DNase sequences that do not map within DNase I HS sites. This pattern exists between sequences that are on the same strand (+/+ and -/-) and on opposite strands (-/+ and +/-). (C) By overlaying the data from the different strand sets, we find that the two opposite stranded sets each have an approximately three base offset from the same stranded set.
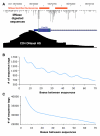
Figure 6. MNase-Derived Sequence Tags Define Nucleosomes Near the Boundaries of DNase I Hypersensitive Sites
(A) Representative example of MNase sequence tags and MNase identified positioned nucleosomes (red bars). (B) Regions of DNase I HS sites that overlap positioned nucleosomes are enriched for the 10.4 bp periodicity also detected in the whole-genome data. (C) Regions of DNase I HS sites not associated with a positioned nucleosome do not display the 10.4 bp oscillation pattern.
Similar articles
- Genome-wide mapping of DNase hypersensitive sites using massively parallel signature sequencing (MPSS).
Crawford GE, Holt IE, Whittle J, Webb BD, Tai D, Davis S, Margulies EH, Chen Y, Bernat JA, Ginsburg D, Zhou D, Luo S, Vasicek TJ, Daly MJ, Wolfsberg TG, Collins FS. Crawford GE, et al. Genome Res. 2006 Jan;16(1):123-31. doi: 10.1101/gr.4074106. Epub 2005 Dec 12. Genome Res. 2006. PMID: 16344561 Free PMC article. - Defining Regulatory Elements in the Human Genome Using Nucleosome Occupancy and Methylome Sequencing (NOMe-Seq).
Rhie SK, Schreiner S, Farnham PJ. Rhie SK, et al. Methods Mol Biol. 2018;1766:209-229. doi: 10.1007/978-1-4939-7768-0_12. Methods Mol Biol. 2018. PMID: 29605855 Free PMC article. - DNase-chip: a high-resolution method to identify DNase I hypersensitive sites using tiled microarrays.
Crawford GE, Davis S, Scacheri PC, Renaud G, Halawi MJ, Erdos MR, Green R, Meltzer PS, Wolfsberg TG, Collins FS. Crawford GE, et al. Nat Methods. 2006 Jul;3(7):503-9. doi: 10.1038/nmeth888. Nat Methods. 2006. PMID: 16791207 Free PMC article. - Advances of DNase-seq for mapping active gene regulatory elements across the genome in animals.
Chen A, Chen D, Chen Y. Chen A, et al. Gene. 2018 Aug 15;667:83-94. doi: 10.1016/j.gene.2018.05.033. Epub 2018 May 14. Gene. 2018. PMID: 29772251 Review. - Role of ChIP-seq in the discovery of transcription factor binding sites, differential gene regulation mechanism, epigenetic marks and beyond.
Mundade R, Ozer HG, Wei H, Prabhu L, Lu T. Mundade R, et al. Cell Cycle. 2014;13(18):2847-52. doi: 10.4161/15384101.2014.949201. Cell Cycle. 2014. PMID: 25486472 Free PMC article. Review.
Cited by
- SwissRegulon, a database of genome-wide annotations of regulatory sites: recent updates.
Pachkov M, Balwierz PJ, Arnold P, Ozonov E, van Nimwegen E. Pachkov M, et al. Nucleic Acids Res. 2013 Jan;41(Database issue):D214-20. doi: 10.1093/nar/gks1145. Epub 2012 Nov 24. Nucleic Acids Res. 2013. PMID: 23180783 Free PMC article. - The Principles and Applications of High-Throughput Sequencing Technologies.
Lee JY. Lee JY. Dev Reprod. 2023 Apr;27(1):9-24. doi: 10.12717/DR.2023.27.1.9. Epub 2023 Mar 31. Dev Reprod. 2023. PMID: 38075439 Free PMC article. - Molecular and computational approaches to map regulatory elements in 3D chromatin structure.
Lee BH, Rhie SK. Lee BH, et al. Epigenetics Chromatin. 2021 Mar 19;14(1):14. doi: 10.1186/s13072-021-00390-y. Epigenetics Chromatin. 2021. PMID: 33741028 Free PMC article. Review. - Identifying novel transcriptional components controlling energy metabolism.
Gupta RK, Rosen ED, Spiegelman BM. Gupta RK, et al. Cell Metab. 2011 Dec 7;14(6):739-45. doi: 10.1016/j.cmet.2011.11.007. Cell Metab. 2011. PMID: 22152302 Free PMC article. Review. - XL-DNase-Seq: Footprinting Analysis of Dynamic Transcription Factors.
Oh KS, Aqdas M, Sung MH. Oh KS, et al. Methods Mol Biol. 2024;2846:243-261. doi: 10.1007/978-1-0716-4071-5_15. Methods Mol Biol. 2024. PMID: 39141240
References
- Agarwal S, Rao A. Modulation of chromatin structure regulates cytokine gene expression during T cell differentiation. Immunity. 1998;9:765–775. - PubMed
- Barski A, Cuddapah S, Cui K, Roh TY, Schones DE, Wang Z, Wei G, Chepelev I, Zhao K. High-resolution profiling of histone methylations in the human genome. Cell. 2007;129:823–837. - PubMed
- Beissbarth T, Speed TP. GOstat: find statistically overrepresented Gene Ontologies within a group of genes. Bioinformatics. 2004;20:1464–1465. - PubMed
- Bell AC, West AG, Felsenfeld G. The protein CTCF is required for the enhancer blocking activity of vertebrate insulators. Cell. 1999;98:387–396. - PubMed
- Carninci P, Kasukawa T, Katayama S, Gough J, Frith MC, Maeda N, Oyama R, Ravasi T, Lenhard B, Wells C, et al. The transcriptional landscape of the Mamm. Genome. Science. 2005;309:1559–1563. - PubMed
Publication types
MeSH terms
Substances
LinkOut - more resources
Full Text Sources
Other Literature Sources
Molecular Biology Databases
Research Materials


