A causal role for ERG in neoplastic transformation of prostate epithelium - PubMed (original) (raw)
A causal role for ERG in neoplastic transformation of prostate epithelium
Olga Klezovitch et al. Proc Natl Acad Sci U S A. 2008.
Abstract
A significant proportion of human prostate cancers carry a chromosomal rearrangement resulting in the overexpression of the ETS transcription factor, ERG; however, the functional significance of this event is poorly understood. We report here that up-regulation of ERG transcript is sufficient for the initiation of prostate neoplasia. In agreement with measurements of ERG transcripts, we found that ERG protein is expressed in neoplastic human prostate epithelium. Overexpression of ERG in prostate cell lines increased cell invasion. Moreover, targeted expression of this transcript in vivo in luminal prostate epithelial cells of transgenic mice results in initiation of prostate neoplasia observed as the development of focal precancerous prostatic intraepithelial neoplasia (PIN). Similar to human cancers, luminal epithelial cells in these PIN lesions displace diminishing in numbers basal epithelial cells and establish direct contact with the stromal cell compartment. Loss of basal cells is considered to be one of the critical hallmarks of human prostate cancer; however, the mechanisms responsible for this event were unknown. We propose that up-regulation of ERG in human prostate cancer activates cell invasion programs that subsequently displace basal cells by neoplastic epithelium. Our data demonstrate that ERG plays an important causal role in the transformation of prostate epithelium and should be considered as a target for prevention or early therapeutic intervention.
Conflict of interest statement
The authors declare no conflict of interest.
Figures
Fig. 1.
Cellular and molecular analysis of ERG in primary prostate tumors and prostate cell lines. (A–C′) ERG localizes to the nucleus of luminal epithelial cells in primary human prostate cancer. Serial frozen sections of primary human prostate tumors expressing high (A and B) and low (C and C′) levels of ERG mRNA were stained with H&E (A–C) or anti-ERG (green in A′–C′) and anti-keratin 8 (red in A′–C′, luminal cell marker) antibodies. [Scale bar: 0.11 mm (A and A′) and 50 μm (B–C′).] (D) Schematic representation of ΔN-ERG expression construct. (E) Western blot analysis of cells transfected with GFP or ΔN-ERG construct. Total protein extracts were analyzed with anti-ERG or anti-β-actin antibodies. (F) Changes in the rates of cell accumulation upon overexpression of ΔN-ERG. Growth curves of BPH-1 cells expressing GFP (blue) or ΔN-ERG (pink) are shown (means ± SD, n = 3; *, P < 0.001). (G) Increase in extracellular matrix invasion of BPH-1 cells upon overexpression of ΔN-ERG. Migration and Matrigel invasion of BPH-1 cells overexpressing GFP or ΔN-ERG were analyzed by Transwell migration and invasion assays (means ± SD, n = 3; *, P < 0.001. (H) Increase in ΔN-ERG-induced cell invasion is mediated by cell surface serine proteases. Matrigel invasion of BPH-1 cells overexpressing GFP or ΔN-ERG in the presence of DMSO, GM6001 (broad spectrum MMP inhibitor), GM6001 control, MMP3 inhibitor, MMP2/9 inhibitor, and PAI-1 (cell surface serine protease inhibitor) is shown (means ± SD, n = 3; *, P < 0.001). (I) Transcript alterations associated with high levels of ERG in human prostate tumors (PRCA). Three microarray datasets comprising transcript abundance measurements from human prostate cancers were evaluated. Numbers in Venn diagrams correspond to significant ERG-associated gene expression changes in common between datasets or unique to individual datasets. (J) ERG-associated transcript alterations between immortalized human prostate epithelial cells (BPH-1) overexpressing ERG and human prostate cancers overexpressing ERG. (K) Enrichment plot of BPH ERG gene signature in human tumors. The plot shows the locations of the BPH ERG gene signature in the gene set ranked by the ERG phenotype in human prostate tumors. The running enrichment score (RES) as a function of position in the gene list is shown. The signal-to-noise ranks of all 9,446 genes in the gene set are shown, with low ranks indicating genes up-regulated in high-ERG tumors and high ranks indicating genes down-regulated in high-ERG tumors. BPH-1 ERG signature genes are clearly overrepresented on the left side of the gene list, representing their enrichment in the genes significantly up-regulated in high-ERG tumors (P = 0.01). (L) Genes comprising a signature common between human prostate tumors expressing high ERG levels (–9). Each heat map column represents a different microdissected human prostate cancer sample, with ratios reflecting transcript abundance relative to the mean.
Fig. 2.
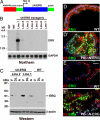
Generation of transgenic mice overexpressing ΔN-ERG in prostate epithelium. (A) Schematic representation of probasin-ΔN-ERG (PB-ΔN-ERG) transgene. (B) The PB-ΔN-ERG transgenic mouse line 1 expresses highest levels of ΔN-ERG mRNA. Total RNA was extracted from the prostate glands of 13-week-old control (WT) and transgenic (lines 1–7) mice and analyzed by Northern blot hybridization with ERG and GAPDH probes. (C) ΔN-ERG protein is expressed at highest levels in the ventral prostates. Total proteins extracted from ventral (V), dorsolateral (DL), and anterior (A) prostates of 8-month-old transgenic lines 1 and 2 were analyzed by Western blotting with anti-ERG and anti-β-actin antibodies. (D–E′) Immunofluorescent staining of 8-month-old wild-type (WT) and PB-ΔN-ERG ventral mouse prostates with anti-ERG antibodies (green) and anti-keratin 8 (red in D and D′) or anti-keratin 5 (red in E and E′) antibodies is shown. Note nuclear ERG staining in luminal prostate epithelial cells (keratin 8+, keratin 5−) of ΔN-ERG mice. Blue is nuclear DAPI counterstain. [Scale bar: 26 μm (E).]
Fig. 3.
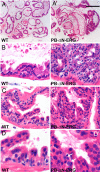
PIN in PB-ΔN-ERG mice. (A–D′) Histologic appearance of ventral prostate lobes from 9-month-old wild-type (WT) and PB-ΔN-ERG animals. Tissue sections were stained with H&E and analyzed with ×4 (A–A′) and ×40 (B–D′) objectives. The PB-ΔN-ERG prostates developed PIN foci of crowded and pseudostratified luminal epithelial cells that formed cribriform (B′) and micropapillary (C′ and D′) architectural patterns. Mutant epithelial cells displayed variable degrees of loss of nuclear polarization and nuclear pleomorphism. Only a minority of PIN cells had prominent nucleoli (arrows in D′). The most cellularized regions of the wild-type glands (B–D) are shown for comparison. [Scale bar: 0.4 mm (A and A′), 40 μm (B–C′), and 20 μm (D and D′).]
Fig. 4.
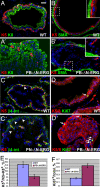
Analysis of cell type representation in prostates of PB-ΔN-ERG mice. (A–D′) Immunofluorescent staining of ventral prostate glands from 8-month-old wild-type (WT) and PB-ΔN-ERG transgenic mice with anti-keratin 5 (K5) and anti-keratin 8 (K8) (A and A′), anti-smooth muscle actin (SMA) and anti-keratin 5 (K5) (B and B′), anti-β4-integrin (β4-int) and anti-keratin 5 (K5) (C and C′), and combined anti-keratins 5 and 8 (K5/8) and anti-Ki67 (D and D′) antibodies. Boxed areas in B and B′ are shown at higher magnification in the Insets. Note that although in the wild-type prostate basal cells (K5+) separate stromal (SMO+) and luminal (K8+) cell compartments (A and B), in PB-ΔN-ERG transgenic mice luminal cells displace basal cells and directly contact stromal cell layer (A′ and B′). Note that β4-integrin staining is associated with basal cells (K5+) in the wild-type prostates; however, it is up-regulated in the luminal cells (K5−) in PN-ΔN-ERG prostates (arrowheads in C and C′). (D and D′) Arrows denote cycling cells (Ki67+). (E) Expansion of luminal cells and decrease in proportion of basal cells in 8-month-old PB-ΔN-ERG mice. Ratio of basal cells to the total basal and luminal cell numbers ± SD is shown (n = 3, t test, P = 0.007). (F) Increase in the ratio of proliferating epithelial cells in 8-month-old PB-ΔN-ERG mice. Ratio of Ki67+ cells to the total epithelial cells ± SD is shown (n = 3, t test, P = 0.0006). [Scale bar: 20 μm (A–D′).]
Similar articles
- TMPRSS2- driven ERG expression in vivo increases self-renewal and maintains expression in a castration resistant subpopulation.
Casey OM, Fang L, Hynes PG, Abou-Kheir WG, Martin PL, Tillman HS, Petrovics G, Awwad HO, Ward Y, Lake R, Zhang L, Kelly K. Casey OM, et al. PLoS One. 2012;7(7):e41668. doi: 10.1371/journal.pone.0041668. Epub 2012 Jul 30. PLoS One. 2012. PMID: 22860005 Free PMC article. - Role of the TMPRSS2-ERG gene fusion in prostate cancer.
Tomlins SA, Laxman B, Varambally S, Cao X, Yu J, Helgeson BE, Cao Q, Prensner JR, Rubin MA, Shah RB, Mehra R, Chinnaiyan AM. Tomlins SA, et al. Neoplasia. 2008 Feb;10(2):177-88. doi: 10.1593/neo.07822. Neoplasia. 2008. PMID: 18283340 Free PMC article. - ETS family transcription factors collaborate with alternative signaling pathways to induce carcinoma from adult murine prostate cells.
Zong Y, Xin L, Goldstein AS, Lawson DA, Teitell MA, Witte ON. Zong Y, et al. Proc Natl Acad Sci U S A. 2009 Jul 28;106(30):12465-70. doi: 10.1073/pnas.0905931106. Epub 2009 Jul 10. Proc Natl Acad Sci U S A. 2009. PMID: 19592505 Free PMC article. - Preneoplastic prostate lesions: an opportunity for prostate cancer prevention.
Nelson WG, De Marzo AM, Deweese TL, Lin X, Brooks JD, Putzi MJ, Nelson CP, Groopman JD, Kensler TW. Nelson WG, et al. Ann N Y Acad Sci. 2001 Dec;952:135-44. doi: 10.1111/j.1749-6632.2001.tb02734.x. Ann N Y Acad Sci. 2001. PMID: 11795433 Review. - The oncogenic role of the ETS transcription factors MEF and ERG.
Sashida G, Bazzoli E, Menendez S, Liu Y, Nimer SD. Sashida G, et al. Cell Cycle. 2010 Sep 1;9(17):3457-9. doi: 10.4161/cc.9.17.13000. Epub 2010 Sep 13. Cell Cycle. 2010. PMID: 20814243 Free PMC article. Review.
Cited by
- RAD21 promotes oncogenesis and lethal progression of prostate cancer.
Su XA, Stopsack KH, Schmidt DR, Ma D, Li Z, Scheet PA, Penney KL, Lotan TL, Abida W, DeArment EG, Lu K, Janas T, Hu S, Vander Heiden MG, Loda M, Boselli M, Amon A, Mucci LA. Su XA, et al. Proc Natl Acad Sci U S A. 2024 Sep 3;121(36):e2405543121. doi: 10.1073/pnas.2405543121. Epub 2024 Aug 27. Proc Natl Acad Sci U S A. 2024. PMID: 39190349 Free PMC article. - Transcription Factors in Prostate Cancer: Insights for Disease Development and Diagnostic and Therapeutic Approaches.
Silva KCS, Tambwe N, Mahfouz DH, Wium M, Cacciatore S, Paccez JD, Zerbini LF. Silva KCS, et al. Genes (Basel). 2024 Apr 2;15(4):450. doi: 10.3390/genes15040450. Genes (Basel). 2024. PMID: 38674385 Free PMC article. Review. - Identification of novel somatic fusions of ERG-VEGFA, TMPRSS2-ERG, and VEGFA-TMPRSS2 in prostate cancer treated with anlotinib and androgen deprivation therapy: A case report.
Liu Q, Wang S, Wang Z, Tang P, Zhang D, Lan W, Jiang J. Liu Q, et al. Cancer Innov. 2022 Jun 9;1(1):114-118. doi: 10.1002/cai2.11. eCollection 2022 Jun. Cancer Innov. 2022. PMID: 38089454 Free PMC article. - SND1 binds to ERG and promotes tumor growth in genetic mouse models of prostate cancer.
Liao SY, Rudoy D, Frank SB, Phan LT, Klezovitch O, Kwan J, Coleman I, Haffner MC, Li D, Nelson PS, Emili A, Vasioukhin V. Liao SY, et al. Nat Commun. 2023 Nov 16;14(1):7435. doi: 10.1038/s41467-023-43245-8. Nat Commun. 2023. PMID: 37973913 Free PMC article. - SET7/9-mediated methylation affects oncogenic functions of histone demethylase JMJD2A.
Gu R, Kim TD, Song H, Sui Y, Shin S, Oh S, Janknecht R. Gu R, et al. JCI Insight. 2023 Oct 23;8(20):e164990. doi: 10.1172/jci.insight.164990. JCI Insight. 2023. PMID: 37870957 Free PMC article.
References
- Tomlins SA, et al. Recurrent fusion of TMPRSS2 and ETS transcription factor genes in prostate cancer. Science. 2005;310:644–648. - PubMed
- Perner S, et al. TMPRSS2-ERG fusion prostate cancer: An early molecular event associated with invasion. Am J Surg Pathol. 2007;31:882–888. - PubMed
- Perner S, et al. TMPRSS2:ERG fusion-associated deletions provide insight into the heterogeneity of prostate cancer. Cancer Res. 2006;66:8337–8341. - PubMed
- Demichelis F, et al. TMPRSS2:ERG gene fusion associated with lethal prostate cancer in a watchful waiting cohort. Oncogene. 2007;26:4596–4599. - PubMed
- Petrovics G, et al. Frequent overexpression of ETS-related gene-1 (ERG1) in prostate cancer transcriptome. Oncogene. 2005;24:3847–3852. - PubMed
Publication types
MeSH terms
Substances
Grants and funding
- U01 CA084294/CA/NCI NIH HHS/United States
- P01 CA085859/CA/NCI NIH HHS/United States
- U01CA84294/CA/NCI NIH HHS/United States
- P01CA85859/CA/NCI NIH HHS/United States
- 5R01-CA102365/CA/NCI NIH HHS/United States
- R01 CA102365/CA/NCI NIH HHS/United States
LinkOut - more resources
Full Text Sources
Other Literature Sources
Molecular Biology Databases
Research Materials


