Comparison of mixed-model approaches for association mapping - PubMed (original) (raw)
Comparative Study
Comparison of mixed-model approaches for association mapping
Benjamin Stich et al. Genetics. 2008 Mar.
Abstract
Association-mapping methods promise to overcome the limitations of linkage-mapping methods. The main objectives of this study were to (i) evaluate various methods for association mapping in the autogamous species wheat using an empirical data set, (ii) determine a marker-based kinship matrix using a restricted maximum-likelihood (REML) estimate of the probability of two alleles at the same locus being identical in state but not identical by descent, and (iii) compare the results of association-mapping approaches based on adjusted entry means (two-step approaches) with the results of approaches in which the phenotypic data analysis and the association analysis were performed in one step (one-step approaches). On the basis of the phenotypic and genotypic data of 303 soft winter wheat (Triticum aestivum L.) inbreds, various association-mapping methods were evaluated. Spearman's rank correlation between P-values calculated on the basis of one- and two-stage association-mapping methods ranged from 0.63 to 0.93. The mixed-model association-mapping approaches using a kinship matrix estimated by REML are more appropriate for association mapping than the recently proposed QK method with respect to (i) the adherence to the nominal alpha-level and (ii) the adjusted power for detection of quantitative trait loci. Furthermore, we showed that our data set could be analyzed by using two-step approaches of the proposed association-mapping method without substantially increasing the empirical type I error rate in comparison to the corresponding one-step approaches.
Figures
Figure 1.—
Principal coordinate analysis of the 303 entries as well as five wheat cultivars, which are unrelated by pedigree to the 303 entries, based on Rogers' distance estimates. Percentages in parentheses refer to the proportion of variance explained by the principal coordinate.
Figure 2.—
Mean of the squared differences (MSD) between observed and expected _P_-values as well as deviance for different two-stage association-mapping methods depending on threshold T.
Figure 3.—
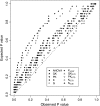
Plot of observed vs. expected _P_-values for the 10 two-stage association-mapping methods.
Figure 4.—
Adjusted power to detect quantitative trait loci (QTL) for the 10 two-stage association-mapping methods depending on the size of the QTL effect Gr. The percentage of phenotypic variation explained by a QTL was calculated for an allele frequency of 0.2.
Similar articles
- Genome Wide Single Locus Single Trait, Multi-Locus and Multi-Trait Association Mapping for Some Important Agronomic Traits in Common Wheat (T. aestivum L.).
Jaiswal V, Gahlaut V, Meher PK, Mir RR, Jaiswal JP, Rao AR, Balyan HS, Gupta PK. Jaiswal V, et al. PLoS One. 2016 Jul 21;11(7):e0159343. doi: 10.1371/journal.pone.0159343. eCollection 2016. PLoS One. 2016. PMID: 27441835 Free PMC article. - Comparison of mixed-model approaches for association mapping in rapeseed, potato, sugar beet, maize, and Arabidopsis.
Stich B, Melchinger AE. Stich B, et al. BMC Genomics. 2009 Feb 27;10:94. doi: 10.1186/1471-2164-10-94. BMC Genomics. 2009. PMID: 19250529 Free PMC article. - Genome-wide quantitative trait locus mapping identifies multiple major loci for brittle rachis and threshability in Tibetan semi-wild wheat (Triticum aestivum ssp. tibetanum Shao).
Jiang YF, Lan XJ, Luo W, Kong XC, Qi PF, Wang JR, Wei YM, Jiang QT, Liu YX, Peng YY, Chen GY, Dai SF, Zheng YL. Jiang YF, et al. PLoS One. 2014 Dec 4;9(12):e114066. doi: 10.1371/journal.pone.0114066. eCollection 2014. PLoS One. 2014. PMID: 25474652 Free PMC article. - Prospects and limits of marker imputation in quantitative genetic studies in European elite wheat (Triticum aestivum L.).
He S, Zhao Y, Mette MF, Bothe R, Ebmeyer E, Sharbel TF, Reif JC, Jiang Y. He S, et al. BMC Genomics. 2015 Mar 11;16(1):168. doi: 10.1186/s12864-015-1366-y. BMC Genomics. 2015. PMID: 25886991 Free PMC article. - A synthetic framework for modeling the genetic basis of phenotypic plasticity and its costs.
Zhai Y, Lv Y, Li X, Wu W, Bo W, Shen D, Xu F, Pang X, Zheng B, Wu R. Zhai Y, et al. New Phytol. 2014 Jan;201(1):357-365. doi: 10.1111/nph.12458. Epub 2013 Sep 13. New Phytol. 2014. PMID: 24032980
Cited by
- Genome Wide Single Locus Single Trait, Multi-Locus and Multi-Trait Association Mapping for Some Important Agronomic Traits in Common Wheat (T. aestivum L.).
Jaiswal V, Gahlaut V, Meher PK, Mir RR, Jaiswal JP, Rao AR, Balyan HS, Gupta PK. Jaiswal V, et al. PLoS One. 2016 Jul 21;11(7):e0159343. doi: 10.1371/journal.pone.0159343. eCollection 2016. PLoS One. 2016. PMID: 27441835 Free PMC article. - Lessons from Dwarf8 on the strengths and weaknesses of structured association mapping.
Larsson SJ, Lipka AE, Buckler ES. Larsson SJ, et al. PLoS Genet. 2013;9(2):e1003246. doi: 10.1371/journal.pgen.1003246. Epub 2013 Feb 21. PLoS Genet. 2013. PMID: 23437002 Free PMC article. - Unveiling the genetic basis of Sclerotinia head rot resistance in sunflower.
Filippi CV, Zubrzycki JE, Di Rienzo JA, Quiroz FJ, Puebla AF, Alvarez D, Maringolo CA, Escande AR, Hopp HE, Heinz RA, Paniego NB, Lia VV. Filippi CV, et al. BMC Plant Biol. 2020 Jul 8;20(1):322. doi: 10.1186/s12870-020-02529-7. BMC Plant Biol. 2020. PMID: 32641108 Free PMC article. - A genome-wide association study of malting quality across eight U.S. barley breeding programs.
Mohammadi M, Blake TK, Budde AD, Chao S, Hayes PM, Horsley RD, Obert DE, Ullrich SE, Smith KP. Mohammadi M, et al. Theor Appl Genet. 2015 Apr;128(4):705-21. doi: 10.1007/s00122-015-2465-5. Epub 2015 Feb 10. Theor Appl Genet. 2015. PMID: 25666272 - Genome-Wide Association Study on Resistance to Stalk Rot Diseases in Grain Sorghum.
Adeyanju A, Little C, Yu J, Tesso T. Adeyanju A, et al. G3 (Bethesda). 2015 Apr 16;5(6):1165-75. doi: 10.1534/g3.114.016394. G3 (Bethesda). 2015. PMID: 25882062 Free PMC article.
References
- Balding, D. J., 2006. A tutorial on statistical methods for population association studies. Nat. Rev. Genet. 7 781–791. - PubMed
- Bernardo, R., 1993. Estimation of coefficient of coancestry using molecular markers in maize. Theor. Appl. Genet. 85 1055–1062. - PubMed
- Bernardo, R., A. Murigneux and Z. Karaman, 1996. Marker-based estimates of identity by descent and alikeness in state among maize inbreds. Theor. Appl. Genet. 93 262–267. - PubMed
Publication types
MeSH terms
LinkOut - more resources
Full Text Sources


