TRPC5 channels undergo changes in gating properties during the activation-deactivation cycle - PubMed (original) (raw)
TRPC5 channels undergo changes in gating properties during the activation-deactivation cycle
Alexander G Obukhov et al. J Cell Physiol. 2008 Jul.
Abstract
TRPC5 are non-specific cation channels activated through phospholipase C-dependent pathways, although the precise gating mechanism is unknown. TRPC5 current-voltage relationships (I-Vs) change systematically during the activation-deactivation cycle, shifting between outwardly rectifying and doubly rectifying shapes. Since several TRP family members exhibit voltage-dependent properties, we investigated whether the various I-V relationships were due to changes in gating. Using patch-clamp recordings of rat TRPC5 transfected HEK293 cells, we found that TRPC5 currents had distinct biophysical characteristics correlated with individual I-V shapes, a phenomenon we call 'phases.' At rest, channels were closed at most potentials, although strong depolarizations (>+80 mV) stimulated small outward currents (Phase 0). For 10-15 sec after activation, voltage steps evoked small inward and large outward currents with time- and voltage-dependent kinetics (Phase 1, outwardly-rectifying I-Vs). At maximal inward amplitude, currents were voltage-independent at all potentials (Phase 2, doubly-rectifying I-Vs owing to Mg2+ block). During desensitization (Phase 3), currents reverted to a Phase 1-like voltage-dependence. La3+ ions potentiated inward TRPC5 currents by promoting a reversible transition from Phase 3 to Phase 2. Single channel recordings revealed asymmetric conductance properties with values of approximately 40 pS at negative potentials and approximately 130 pS at >+60 mV. Mutation of D633, a cytoplasmic residue that mediates Mg2+ block, decreased channel activity at negative potentials during Phase 2. We conclude that TRPC5 gating properties can switch reversibly between voltage-dependent and voltage-independent states. The modulation of phase transitions by external agents such as La3+ and EBP50, a scaffolding protein, may constitute a novel mechanism for regulation of channel activity.
(c) 2008 Wiley-Liss, Inc.
Figures
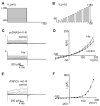
Figure 1. Endogenous currents in control and rTRPC5-transfected HEK293 cells
A-D. Whole-cell recordings in HEK293 cells transfected with H1R-YFP and empty pcDNA3.1 vector. A, B. The stimulation protocol is illustrated with voltage steps superimposed (A) and in sequence (B). C. Superimposed current traces evoked before (i) and after (ii) histamine application. D. I-V plots of averaged current amplitudes measured over the last 5 msec of the 20 msec voltage step, before (‘control’) and after (‘His’) histamine application (n=11 and 6, respectively, mean ± S.E.M.). E-F. Whole-cell recordings in HEK293 cells co-transfected with H1R-YFP and rTRPC5. E. Superimposed current traces evoked by step protocols. F. I-V plot of current amplitudes averaged over the last 5 msec of the 20 msec voltage step (n=5, mean ± S.E.M.).
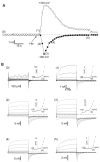
Figure 2. The biophysical properties of histamine-stimulated rTRPC5 currents change during activation and deactivation
Whole-cell recording performed at a holding potential of −60 mV with cycles of voltage-step protocols administered at 3 sec intervals. A. Time course of inward current and outward currents measured at −100 and +100 mV during voltage step protocols. Histamine (His, 10 μM) was applied as indicated by arrow. B (0-5). Superimposed currents elicited by voltage step protocols corresponding to time points indicated in parentheses in A. Dashed lines represent zero current levels. Insets: I-V plots obtained from values averaged over the last 5 msec of the 20 msec voltage step in panel B.
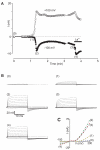
Figure 3. La3+ ions potentiate GTPγS-stimulated rTRPC5 currents by promoting Phase 2 characteristics
Whole-cell currents recorded in an H1R- and rTRPC5-transfected HEK293 cells infused with GTPγS via the patch pipette. Cells were held at −60 mV and stimulated with voltage-step protocols at 3 sec intervals. A. Time course of inward current and outward currents measured at −100 and +100 mV. La3+ (100 μM) was added to the bath as indicated by the bar. B (0-4). Superimposed currents elicited by voltage step protocols corresponding to time points indicated in A. Dashed lines represent zero current levels. C. I-V plots obtained at indicated time points.
Figure 4. Single channel conductance values of rTRPC5 channels are constant during histamine activation
Cell-attached patch recording from an H1R- and rTRPC5-transfected cell. The patch was held at +60 mV, applying a trans-membrane potential of approximately −60 mV to channels. A. Time course of ‘NPo’ changes during the recording, calculated for each consecutive 10 s interval (see Methods). Histamine (10 μM) was added to the bath at the time indicated by the horizontal bar. B. Sample current traces shown at times indicated and by arrows in A. Dashed lines indicate unitary single channel amplitudes obtained from histograms in C. C. Amplitude histograms of single channel openings. Single-channel events longer than 1 ms were selected for analysis at various time points relative to application of histamine. Data prior to histamine application was collected at ∼ 0 to 30 sec (data not shown), during Phase 1 at ∼ 90 to 100 sec (i), and during Phase 2+3 at ∼120 to 180 sec (ii). The Gaussian fits to the data are shown as solid lines. During Phase 1 (i), shortly after histamine application, the histogram contains symmetrical baseline noise centered at 0 pA, and a single peak at ∼2.9 pA, while a third peak centered around 6 pA is seen during Phase 2+3 (ii). D. Single channel responses to stimulus train (i) recorded during Phase 1 (ii), Phase 2 (iii), and Phase 3 (iv).
Figure 5. rTRPC5 channel conductance is asymmetric and decreased by La3+ ions
Outside-out patch recordings from HEK293 cells in control and La3+ (100 μM) containing solution. The patches were held at potentials indicated. The bath (extracellular) solution was Cl−-free solution. A. Traces from one control patch at −60, +20, and +60 mV. B. Traces from a different patch at −60, +20 and +60 mV in the presence of 100 μM La3+. C. Traces obtained from patches held at potentials between +120 to +200 mV in control solution (Ci) and in the presence of 100 μM La3+ (Cii). D. Current-voltage relationship for single channel currents in control (circles) and La3+-containing (squares) extracellular Cl−-free solutions. Values from −100 to +100 mV were obtained from Gaussian fits. Values above +120 mV were determined by eye. Each point represents the mean ± S.E.M (n = 4-10).
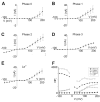
Figure 6. Estimates of channel activity, ‘NPo,’ from recordings of GTPγS-stimulated rTRPC5 currents
**A-E.**Averaged I-V relationships from whole-cell recordings at different times following break-in and initiation of GTPγS perfusion. Data collected at: A. Phase 0: within seconds of establishing whole-cell perfusion. B. Phase 1: from 5-15 sec before peak current. C. Phase 2: at peak current. D. Phase 3: during steady-state currents. E. La3+ during Phase 3: from peak inward current after La3+ application. All recordings in Cl−-free extracellular solution. Number of cells = 5 in all panels except D, where n = 4. Bars indicate S.E.M. F. Averaged I-V data from panels A-E were divided by single channel values in Figure 5D and plotted as estimated NPo at each potential.
Figure 7. Histamine-stimulated currents through D633N mutant rTRPC5 channels
Whole-cell currents recorded in an H1R- and D633N rTRPC5-transfected HEK293 cell stimulated with histamine. Cells were held at −60 mV and voltage-step protocols were administered at 3 sec intervals. A (0-3). Superimposed currents elicited by voltage step protocols. Dashed lines represent zero current levels. B. I-V plots obtained at corresponding time points.
Figure 8. Estimates of channel activity, ‘NPo,’ for Phase 1 and Phase 2 of histamine-stimulated D633N mutant rTRPC5 channels
A. Single channel current amplitudes from cell-attached recordings obtained as in Figures 4 and 5. Dashed lines are linear regression fits to data points at positive and at negative potentials with values of 36 pS at negative potentials and 62 pS at positive potentials (n=3-7 individual determinations for each data point). B. Averaged I-V data from experiments with D633N-transfected cells (n=7) were divided by single channel values and plotted as estimated NPo at each potential.
Similar articles
- TRPC5 activation kinetics are modulated by the scaffolding protein ezrin/radixin/moesin-binding phosphoprotein-50 (EBP50).
Obukhov AG, Nowycky MC. Obukhov AG, et al. J Cell Physiol. 2004 Nov;201(2):227-35. doi: 10.1002/jcp.20057. J Cell Physiol. 2004. PMID: 15334657 - A cytosolic residue mediates Mg2+ block and regulates inward current amplitude of a transient receptor potential channel.
Obukhov AG, Nowycky MC. Obukhov AG, et al. J Neurosci. 2005 Feb 2;25(5):1234-9. doi: 10.1523/JNEUROSCI.4451-04.2005. J Neurosci. 2005. PMID: 15689561 Free PMC article. - Intracellular calcium strongly potentiates agonist-activated TRPC5 channels.
Blair NT, Kaczmarek JS, Clapham DE. Blair NT, et al. J Gen Physiol. 2009 May;133(5):525-46. doi: 10.1085/jgp.200810153. J Gen Physiol. 2009. PMID: 19398778 Free PMC article. - TRPC5.
Zholos AV. Zholos AV. Handb Exp Pharmacol. 2014;222:129-56. doi: 10.1007/978-3-642-54215-2_6. Handb Exp Pharmacol. 2014. PMID: 24756705 Review. - Understanding the role of voltage gating of polymodal TRP channels.
Zhu MX. Zhu MX. J Physiol. 2007 Dec 1;585(Pt 2):321-2. doi: 10.1113/jphysiol.2007.147082. J Physiol. 2007. PMID: 18056113 Free PMC article. Review. No abstract available.
Cited by
- Hypoosmotic- and pressure-induced membrane stretch activate TRPC5 channels.
Gomis A, Soriano S, Belmonte C, Viana F. Gomis A, et al. J Physiol. 2008 Dec 1;586(23):5633-49. doi: 10.1113/jphysiol.2008.161257. Epub 2008 Oct 2. J Physiol. 2008. PMID: 18832422 Free PMC article. - Transient Receptor Potential Canonical (TRPC) Channels: Then and Now.
Chen X, Sooch G, Demaree IS, White FA, Obukhov AG. Chen X, et al. Cells. 2020 Aug 28;9(9):1983. doi: 10.3390/cells9091983. Cells. 2020. PMID: 32872338 Free PMC article. Review. - Involvement of TRPC4 and 5 Channels in Persistent Firing in Hippocampal CA1 Pyramidal Cells.
Arboit A, Reboreda A, Yoshida M. Arboit A, et al. Cells. 2020 Feb 5;9(2):365. doi: 10.3390/cells9020365. Cells. 2020. PMID: 32033274 Free PMC article. - Treasure troves of pharmacological tools to study transient receptor potential canonical 1/4/5 channels.
Rubaiy HN. Rubaiy HN. Br J Pharmacol. 2019 Apr;176(7):832-846. doi: 10.1111/bph.14578. Epub 2019 Mar 6. Br J Pharmacol. 2019. PMID: 30656647 Free PMC article. Review. - Molecular Determinants of the Sensitivity to Gq/11-Phospholipase C-dependent Gating, Gd3+ Potentiation, and Ca2+ Permeability in the Transient Receptor Potential Canonical Type 5 (TRPC5) Channel.
Chen X, Li W, Riley AM, Soliman M, Chakraborty S, Stamatkin CW, Obukhov AG. Chen X, et al. J Biol Chem. 2017 Jan 20;292(3):898-911. doi: 10.1074/jbc.M116.755470. Epub 2016 Dec 5. J Biol Chem. 2017. PMID: 27920205 Free PMC article.
References
- Ambudkar IS. Ca2+ signaling microdomains: platforms for the assembly and regulation of TRPC channels. Trends Pharmacol Sci. 2006;27:25–32. - PubMed
- Bezzerides VJ, Ramsey IS, Kotecha S, Greka A, Clapham DE. Rapid vesicular translocation and insertion of TRP channels. Nat Cell Biol. 2004;6:709–720. - PubMed
- Clapham DE. TRP channels as cellular sensors. Nature. 2003;426:517–24. - PubMed
- Hofmann T, Obukhov AG, Schaefer M, Harteneck C, Gudermann T, Schultz G. Direct activation of human TRPC6 and TRPC3 channels by diacylglycerol. Nature. 1999;397:259–263. - PubMed
- Jung S, Muhle A, Schaefer M, Strotmann R, Schultz G, Plant TD. Lanthanides potentiate TRPC5 currents by an action at extracellular sites close to the pore mouth. J Biol Chem. 2003;278:3562–3571. - PubMed
Publication types
MeSH terms
Substances
LinkOut - more resources
Full Text Sources
Molecular Biology Databases
Miscellaneous


