Quantitative profiling of endogenous retinoic acid in vivo and in vitro by tandem mass spectrometry - PubMed (original) (raw)
. 2008 Mar 1;80(5):1702-8.
doi: 10.1021/ac702030f. Epub 2008 Feb 6.
Affiliations
- PMID: 18251521
- PMCID: PMC4086453
- DOI: 10.1021/ac702030f
Quantitative profiling of endogenous retinoic acid in vivo and in vitro by tandem mass spectrometry
Maureen A Kane et al. Anal Chem. 2008.
Abstract
We report an improved tandem mass spectrometric assay for retinoic acid (RA) applicable to in vitro and in vivo biological samples. This liquid chromatography tandem mass spectrometric (LC/MS/MS) assay for direct RA quantification is the most sensitive to date, with a 62.5 attomol lower limit of detection and a linear range spanning greater than 4 orders of magnitude (from 250 attomol to 10 pmol). This assay resolves all-trans-RA (atRA) from its endogenous geometric isomers, is applicable to samples of limited size (10-20 mg of tissue), and functions with complex biological matrixes. Coefficients of variation are as follows: instrumental, < or =2.6%; intraday, 5.2% +/- 0.7%; interday, 6.7% +/- 0.9%. In vitro capabilities are demonstrated by quantification of endogenous RA and RA production (from retinol) in primary cultured astrocytes. Quantification of endogenous atRA and its geometric isomers in 129SV mouse serum and tissues (liver, kidney, adipose, muscle, spleen, testis, and brain) reveals in vivo utility of the assay. The ability to discriminate spatial concentrations of RA in vivo is illustrated with C57BL/6 mouse brain loci (hippocampus, cortex, olfactory bulb, thalamus, cerebellum, and striatum), as well as with Lewis rat proximal/distal mammary gland regions during various morphological stages: virgin, early pregnancy (e7), late pregnancy (e20), lactating (day 4), involuting day 1, and involuting day 11. This assay provides the sensitivity necessary for direct, endogenous RA quantification necessary to elucidate RA function, e.g., in neurogenesis, morphogenesis, and the contribution of altered RA homeostasis to diseases, such as Alzheimer's disease, type 2 diabetes, obesity, and cancer.
Figures
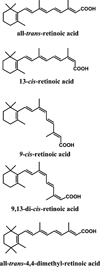
Figure 1
Structures of atRA, its isomers, and the internal standard 4,4-dimethyl-RA.
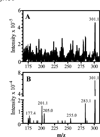
Figure 2
RA mass spectra. (A) Q1 scan showing [M + H]+ (m/z: 301.1). (B) Q3 scan showing [M + H]+ and product ions obtained after fragmentation. Both scans were obtained by infusing 200 nM RA at 10 µL/min. Note the reduction in background in (B).
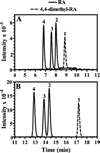
Figure 3
SRM chromatograms of standard solutions: (A) gradient 1, cultured cell/subcellular fraction protocol; (B) gradient 2, tissue protocol. The solid line corresponds to m/z Q1:301/Q3:205, and the broken line corresponds to m/z Q1:329/Q3:151: 1, 4,4-dimethyl-RA; 2, atRA; 3, 9cRA; 4, 13cRA. 9,13-dcRA elutes between 3 and 4 (data not shown).
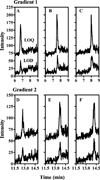
Figure 4
LOD and LOQ for (A–C) gradient 1, cultured cell/subcellular fraction protocol, and (D and F) gradient 2, tissue protocol. (A and D) 13cRA. (B and E) 9cRA. (C and F) atRA.
Figure 5
Representative calibration curve for atRA. Data were obtained using the cultured cell protocol (_r_2, 0.999). Similar curves were generated for the tissue protocol and for the other geometric isomers with both protocols. Note the functionality of the assay with values of <50 fmol (inset).
Figure 6
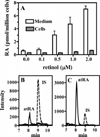
Quantification of endogenous atRA and atRA biosynthesis in primary cultures of hippocampus astrocytes. (A) Data were generated using gradient 1 after 5 h of incubation with retinol. Data are averages of triplicates. (B and C) Representative SRM chromatograms of RA in cells and medium, respectively, after incubation with 0.5 µM retinol: IS, internal standard.
Figure 7
Representative SRM chromatograms of endogenous RA. Data were generated with gradient 2. (A) Analysis of liver extract (~40 mg of tissue) from 2–4 month old, male 129SV mice fed 4 IU/g vitamin A. (B) Serum (~150 µL) from the same mice. The solid line represents RA (m/z Q1:301/Q3:205); the dashed line represents the IS 4,4-dimethyl-RA (m/z Q1:329/Q3:151). INT, nonspecific signal.
Figure 8
Quantification of atRA in rat mammary gland. Open bars show atRA in the proximal region; filled bars show atRA in the distal region. Also shown are serum measurements. Samples were collected from female Lewis rats fed a stock diet: V, virgin; EP, early pregnancy (e7); LP, late pregnancy (e20); L, lactation (day 4); ID1, involution day 1; ID11, involution day 11. *P < 0.05, compared to virgin (mammary) or compared to L (serum); **P < 0.05 between proximal and distal. Data are means ± SD, n = 3–13 samples.
Similar articles
- Quantification of endogenous retinoic acid in limited biological samples by LC/MS/MS.
Kane MA, Chen N, Sparks S, Napoli JL. Kane MA, et al. Biochem J. 2005 May 15;388(Pt 1):363-9. doi: 10.1042/BJ20041867. Biochem J. 2005. PMID: 15628969 Free PMC article. - HPLC/UV quantitation of retinal, retinol, and retinyl esters in serum and tissues.
Kane MA, Folias AE, Napoli JL. Kane MA, et al. Anal Biochem. 2008 Jul 1;378(1):71-9. doi: 10.1016/j.ab.2008.03.038. Epub 2008 Mar 25. Anal Biochem. 2008. PMID: 18410739 Free PMC article. - Ethanol elevates physiological all-trans-retinoic acid levels in select loci through altering retinoid metabolism in multiple loci: a potential mechanism of ethanol toxicity.
Kane MA, Folias AE, Wang C, Napoli JL. Kane MA, et al. FASEB J. 2010 Mar;24(3):823-32. doi: 10.1096/fj.09-141572. Epub 2009 Nov 4. FASEB J. 2010. PMID: 19890016 Free PMC article. - Analysis, occurrence, and function of 9-cis-retinoic acid.
Kane MA. Kane MA. Biochim Biophys Acta. 2012 Jan;1821(1):10-20. doi: 10.1016/j.bbalip.2011.09.012. Epub 2011 Oct 1. Biochim Biophys Acta. 2012. PMID: 21983272 Review. - Retinoid production and catabolism: role of diet in regulating retinol esterification and retinoic Acid oxidation.
Ross AC. Ross AC. J Nutr. 2003 Jan;133(1):291S-296S. doi: 10.1093/jn/133.1.291S. J Nutr. 2003. PMID: 12514312 Review.
Cited by
- Cardiac optogenetics.
Entcheva E. Entcheva E. Am J Physiol Heart Circ Physiol. 2013 May;304(9):H1179-91. doi: 10.1152/ajpheart.00432.2012. Epub 2013 Mar 1. Am J Physiol Heart Circ Physiol. 2013. PMID: 23457014 Free PMC article. Review. - Normalizing Microbiota-Induced Retinoic Acid Deficiency Stimulates Protective CD8(+) T Cell-Mediated Immunity in Colorectal Cancer.
Bhattacharya N, Yuan R, Prestwood TR, Penny HL, DiMaio MA, Reticker-Flynn NE, Krois CR, Kenkel JA, Pham TD, Carmi Y, Tolentino L, Choi O, Hulett R, Wang J, Winer DA, Napoli JL, Engleman EG. Bhattacharya N, et al. Immunity. 2016 Sep 20;45(3):641-655. doi: 10.1016/j.immuni.2016.08.008. Epub 2016 Aug 30. Immunity. 2016. PMID: 27590114 Free PMC article. - Retinoids in the Pathogenesis and Treatment of Liver Diseases.
Melis M, Tang XH, Trasino SE, Gudas LJ. Melis M, et al. Nutrients. 2022 Mar 31;14(7):1456. doi: 10.3390/nu14071456. Nutrients. 2022. PMID: 35406069 Free PMC article. Review. - Altered RBP1 Gene Expression Impacts Epithelial Cell Retinoic Acid, Proliferation, and Microenvironment.
Yu J, Perri M, Jones JW, Pierzchalski K, Ceaicovscaia N, Cione E, Kane MA. Yu J, et al. Cells. 2022 Feb 24;11(5):792. doi: 10.3390/cells11050792. Cells. 2022. PMID: 35269414 Free PMC article. - Identification of 9-cis-retinoic acid as a pancreas-specific autacoid that attenuates glucose-stimulated insulin secretion.
Kane MA, Folias AE, Pingitore A, Perri M, Obrochta KM, Krois CR, Cione E, Ryu JY, Napoli JL. Kane MA, et al. Proc Natl Acad Sci U S A. 2010 Dec 14;107(50):21884-9. doi: 10.1073/pnas.1008859107. Epub 2010 Nov 29. Proc Natl Acad Sci U S A. 2010. PMID: 21115832 Free PMC article.
References
- Wolf G. Physiol. Rev. 1984;64:873–937. - PubMed
- Mark M, Ghyselinck ND, Chambon P. Annu. Rev. Pharmacol. Toxicol. 2006;46:451–480. - PubMed
- Maden M. Proc. Nutr. Soc. 2001;59:65–73. - PubMed
- Ruberte E, Friederich V, Chambon P, Moriss-Kay G. Development. 1991;111:45–60. - PubMed
- Ong DE. Nutr. Rev. 1994;52:S24–S31. - PubMed
Publication types
MeSH terms
Substances
Grants and funding
- R01 AG013566/AG/NIA NIH HHS/United States
- R01 AA017927/AA/NIAAA NIH HHS/United States
- AG13566/AG/NIA NIH HHS/United States
- DK46839/DK/NIDDK NIH HHS/United States
- F32 DK066924/DK/NIDDK NIH HHS/United States
- R01 DK036870/DK/NIDDK NIH HHS/United States
- DK36870/DK/NIDDK NIH HHS/United States
- R01 DK047839/DK/NIDDK NIH HHS/United States
- R01 DK090522/DK/NIDDK NIH HHS/United States
LinkOut - more resources
Full Text Sources
Other Literature Sources
