A survey of allelic imbalance in F1 mice - PubMed (original) (raw)
A survey of allelic imbalance in F1 mice
Catarina D Campbell et al. Genome Res. 2008 Apr.
Abstract
There are widespread, genetically determined differences in gene expression. However, methods that compare transcript levels between individuals are subject to trans-acting effects and environmental differences. By looking at allele-specific expression in the F1 progeny of inbred mice, we can directly test for allelic imbalance (AI), which must be due to cis-acting variants in the parental strains. We tested over one hundred genes for AI between C57Bl/6J and A/J alleles in F1 mice, including a validation set of 23 genes enriched for cis-acting variants and a second set of 92 genes whose orthologs were previously examined for AI in humans. We assayed an average of two transcribed SNPs per gene in liver, spleen, and brain from three male and three female F1 mice. In the set of 92 genes, we observed 33 genes (36%) with significant AI including genes with AI that was specific to certain tissues or transcripts. We also observed extensive tissue-specific AI, with 11 out of 92 genes (12%) having differences in AI between tissues. Interestingly, several genes with alternate transcripts have transcript-specific AI. Finally, we observed that the presence of AI in human genes was correlated to the presence of AI in the mouse orthologs (one-tailed P = 0.003), suggesting that certain genes may be more tolerant of cis-acting variation across species.
Figures
Figure 1.
Summary of genes tested and major findings.
Figure 2.
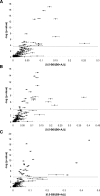
Magnitude of allelic imbalance. The statistical significance from Wilcoxon rank sum tests (-log of the _P_-value) is plotted against the magnitude of AI (absolute value of the difference between 0.5 [no AI] and the average ratio B6/[AJ + B6]) for each of the 115 genes in each tissue. The dotted line indicates an empirical P = 0.05. Error bars are the standard error of the mean; genes with large standard errors have SNP differences in AI. (A) brain; (B) liver; (C) spleen.
Figure 3.
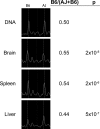
Example of tissue-specific allelic imbalance in Emilin2. Representative spectra of a transcribed SNP assayed in F1 genomic DNA and cDNA from three tissues. The peak locations for the A/J and B6 alleles are marked. For this gene, the B6 allele peak is higher than the A/J allele peak in brain and spleen, but the A/J allele peak is higher than the B6 peak in liver.
Figure 4.
Overlap of genes with allelic imbalance between tissues. For this analysis, only the 33 genes with any evidence of AI were considered. Three genes are represented twice in the diagram because two of the tissues had evidence for allelic imbalance favoring alleles from opposite strains.
Figure 5.
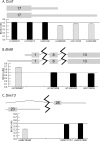
Examples of transcript-specific allelic imbalance. Representations of the exon and UTR structures are plotted with the thicker bars symbolizing coding sequence and the thinner bars symbolizing UTR sequence. Exon numbers are given in the bars for each exon. These diagrams are based on information from the UCSC Genome Browser (genome.ucsc.edu). Below the representation of each gene, a graph of B6/(A/J + B6) is plotted for SNPs that fall within the exons shown. The horizontal line across each graph marks a 50:50 ratio of B6 to A/J alleles. (A) Ccnf has two transcripts that differ in 3′ UTR length; data shown are from spleen. (B) Brd8 has two transcripts that differ in 5′ UTR length; data shown are the average of all tissues. (C) Snx13 has two transcripts with different last exons and 3′ UTRs; data shown are the average of all tissues.
Similar articles
- Gene expression allelic imbalance in ovine brown adipose tissue impacts energy homeostasis.
Ghazanfar S, Vuocolo T, Morrison JL, Nicholas LM, McMillen IC, Yang JYH, Buckley MJ, Tellam RL. Ghazanfar S, et al. PLoS One. 2017 Jun 30;12(6):e0180378. doi: 10.1371/journal.pone.0180378. eCollection 2017. PLoS One. 2017. PMID: 28665992 Free PMC article. - The abundance of cis-acting loci leading to differential allele expression in F1 mice and their relationship to loci harboring genes affecting complex traits.
Yeo S, Hodgkinson CA, Zhou Z, Jung J, Leung M, Yuan Q, Goldman D. Yeo S, et al. BMC Genomics. 2016 Aug 11;17(1):620. doi: 10.1186/s12864-016-2922-9. BMC Genomics. 2016. PMID: 27515598 Free PMC article. - Allelic expression imbalance of the schizophrenia susceptibility gene CHI3L1: evidence of cis-acting variation and tissue specific regulation.
Hill MJ, Kenny E, Roche S, Morris DW, Corvin A, Hawi Z, Gill M, Anney RJ. Hill MJ, et al. Psychiatr Genet. 2011 Dec;21(6):281-6. doi: 10.1097/YPG.0b013e328348045b. Psychiatr Genet. 2011. PMID: 21642896 - Mapping cis-acting regulatory variation in recombinant congenic strains.
Lee PD, Ge B, Greenwood CM, Sinnett D, Fortin Y, Brunet S, Fortin A, Takane M, Skamene E, Pastinen T, Hallett M, Hudson TJ, Sladek R. Lee PD, et al. Physiol Genomics. 2006 Apr 13;25(2):294-302. doi: 10.1152/physiolgenomics.00168.2005. Epub 2006 Jan 31. Physiol Genomics. 2006. PMID: 16449383 - Direct Testing for Allele-Specific Expression Differences Between Conditions.
León-Novelo L, Gerken AR, Graze RM, McIntyre LM, Marroni F. León-Novelo L, et al. G3 (Bethesda). 2018 Feb 2;8(2):447-460. doi: 10.1534/g3.117.300139. G3 (Bethesda). 2018. PMID: 29167272 Free PMC article.
Cited by
- Deletion polymorphism upstream of IRGM associated with altered IRGM expression and Crohn's disease.
McCarroll SA, Huett A, Kuballa P, Chilewski SD, Landry A, Goyette P, Zody MC, Hall JL, Brant SR, Cho JH, Duerr RH, Silverberg MS, Taylor KD, Rioux JD, Altshuler D, Daly MJ, Xavier RJ. McCarroll SA, et al. Nat Genet. 2008 Sep;40(9):1107-12. doi: 10.1038/ng.215. Nat Genet. 2008. PMID: 19165925 Free PMC article. - Genomic features that predict allelic imbalance in humans suggest patterns of constraint on gene expression variation.
Tung J, Fédrigo O, Haygood R, Mukherjee S, Wray GA. Tung J, et al. Mol Biol Evol. 2009 Sep;26(9):2047-59. doi: 10.1093/molbev/msp113. Epub 2009 Jun 8. Mol Biol Evol. 2009. PMID: 19506001 Free PMC article. - Extent of differential allelic expression of candidate breast cancer genes is similar in blood and breast.
Maia AT, Spiteri I, Lee AJ, O'Reilly M, Jones L, Caldas C, Ponder BA. Maia AT, et al. Breast Cancer Res. 2009;11(6):R88. doi: 10.1186/bcr2458. Epub 2009 Dec 10. Breast Cancer Res. 2009. PMID: 20003265 Free PMC article. - Tempo and mode of regulatory evolution in Drosophila.
Coolon JD, McManus CJ, Stevenson KR, Graveley BR, Wittkopp PJ. Coolon JD, et al. Genome Res. 2014 May;24(5):797-808. doi: 10.1101/gr.163014.113. Epub 2014 Feb 24. Genome Res. 2014. PMID: 24567308 Free PMC article. - Allelic gene expression imbalance of bovine IGF2, LEP and CCL2 genes in liver, kidney and pituitary.
Olbromski R, Siadkowska E, Zelazowska B, Zwierzchowski L. Olbromski R, et al. Mol Biol Rep. 2013 Feb;40(2):1189-200. doi: 10.1007/s11033-012-2161-3. Epub 2012 Nov 25. Mol Biol Rep. 2013. PMID: 23184004 Free PMC article.
References
- Altshuler D., Hirschhorn J.N., Klannemark M., Lindgren C.M., Vohl M.C., Nemesh J., Lane C.R., Schaffner S.F., Bolk S., Brewer C., Hirschhorn J.N., Klannemark M., Lindgren C.M., Vohl M.C., Nemesh J., Lane C.R., Schaffner S.F., Bolk S., Brewer C., Klannemark M., Lindgren C.M., Vohl M.C., Nemesh J., Lane C.R., Schaffner S.F., Bolk S., Brewer C., Lindgren C.M., Vohl M.C., Nemesh J., Lane C.R., Schaffner S.F., Bolk S., Brewer C., Vohl M.C., Nemesh J., Lane C.R., Schaffner S.F., Bolk S., Brewer C., Nemesh J., Lane C.R., Schaffner S.F., Bolk S., Brewer C., Lane C.R., Schaffner S.F., Bolk S., Brewer C., Schaffner S.F., Bolk S., Brewer C., Bolk S., Brewer C., Brewer C., et al. The common PPARγ Pro12Ala polymorphism is associated with decreased risk of type 2 diabetes. Nat. Genet. 2000;26:76–80. - PubMed
- Altshuler D., Brooks L.D., Chakravarti A., Collins F.S., Daly M.J., Donnelly P., Brooks L.D., Chakravarti A., Collins F.S., Daly M.J., Donnelly P., Chakravarti A., Collins F.S., Daly M.J., Donnelly P., Collins F.S., Daly M.J., Donnelly P., Daly M.J., Donnelly P., Donnelly P. A haplotype map of the human genome. Nature. 2005;437:1299–1320. - PMC - PubMed
- Benjamini Y., Hochberg Y., Hochberg Y. Controlling the false discovery rate: A practical and powerful approach to multiple testing. J. R. Stat. Soc. Ser. B. 1995;57:289–300.
- Brem R.B., Yvert G., Clinton R., Kruglyak L., Yvert G., Clinton R., Kruglyak L., Clinton R., Kruglyak L., Kruglyak L. Genetic dissection of transcriptional regulation in budding yeast. Science. 2002;296:752–755. - PubMed
- Campbell C.D., Lyon H.N., Nemesh J., Drake J.A., Tuomi T., Gaudet D., Zhu X., Cooper R.S., Ardlie K.G., Groop L.C., Lyon H.N., Nemesh J., Drake J.A., Tuomi T., Gaudet D., Zhu X., Cooper R.S., Ardlie K.G., Groop L.C., Nemesh J., Drake J.A., Tuomi T., Gaudet D., Zhu X., Cooper R.S., Ardlie K.G., Groop L.C., Drake J.A., Tuomi T., Gaudet D., Zhu X., Cooper R.S., Ardlie K.G., Groop L.C., Tuomi T., Gaudet D., Zhu X., Cooper R.S., Ardlie K.G., Groop L.C., Gaudet D., Zhu X., Cooper R.S., Ardlie K.G., Groop L.C., Zhu X., Cooper R.S., Ardlie K.G., Groop L.C., Cooper R.S., Ardlie K.G., Groop L.C., Ardlie K.G., Groop L.C., Groop L.C., et al. Association studies of BMI and type 2 diabetes in the neuropeptide Y pathway: A possible role for NPY2R as a candidate gene for type 2 diabetes in men. Diabetes. 2007;56:1460–1467. - PubMed
Publication types
MeSH terms
LinkOut - more resources
Full Text Sources
Other Literature Sources


