The kinesin-8 motor Kif18A suppresses kinetochore movements to control mitotic chromosome alignment - PubMed (original) (raw)
The kinesin-8 motor Kif18A suppresses kinetochore movements to control mitotic chromosome alignment
Jason Stumpff et al. Dev Cell. 2008 Feb.
Abstract
During vertebrate cell division, chromosomes oscillate with periods of smooth motion interrupted by abrupt reversals in direction. These oscillations must be spatially constrained in order to align and segregate chromosomes with high fidelity, but the molecular mechanism for this activity is uncertain. We report here that the human kinesin-8 Kif18A has a primary role in the control of chromosome oscillations. Kif18A accumulates as a gradient on kinetochore microtubules in a manner dependent on its motor activity. Quantitative analyses of kinetochore movements reveal that Kif18A reduces the amplitude of preanaphase oscillations and slows poleward movement during anaphase. Thus, the microtubule-depolymerizing kinesin Kif18A has the unexpected function of suppressing chromosome movements. Based on these findings, we propose a molecular model in which Kif18A regulates kinetochore microtubule dynamics to control mitotic chromosome positioning.
Figures
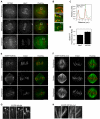
Figure 1. Kif18A displays dynamic, motor-dependent localization to the plus-ends of kinetochore microtubules
(A) Mitotic HeLa cells in the indicated stages were fixed and stained with anti-Kif18A antibodies (green in overlay) and anti-Hec1 antibodies (red in overlay). Scale bar is 5 μm. (B) Magnified views of the regions indicated by white boxes in prometaphase (promet), metaphase (meta) and anaphase (ana) cells in (A). Scale bar is 2 μm. (C) Representative linescan across metaphase sister kinetochores in a HeLa cell stained with anti-Kif18A (green) and anti-Hec1 (red) antibodies. In all scans the peak of Kif18A fluorescence was distal to the peak of Hec1 fluorescence with respect to the centromere (n = 19 kinetochore pairs from 3 cells). (D) The ratio of peak fluorescence intensity on sister kinetochores was calculated from metaphase cells co-stained for Hec1 and Kif18A by immunofluorescence. The peak intensity of Hec1 is equal between sister kinetochores while Kif18A is significantly higher on one sister kinetochore than the other (n = 19 kinetochore pairs from 3 cells; p = 0.001). Error bars indicate SEM. (E and F) Metaphase HeLa cells expressing either EGFP-Kif18A (E) or EGFP-Kif18A-mutant (F) (green in overlay) and stained with human CREST serum to visualize kinetochores (red in overlay). Optical slices from the periphery and the center of each spindle are displayed. Scale bars are 5 μm. (G and H) Magnified images of EGFP-Kif18A (G) or EGFP-Kif18A-mut (H) along kMTs. Scale bars are 1 μm.
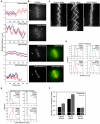
Figure 2. Kif18A affects the oscillatory movements of kinetochores
(A) Distance versus time plots of two kinetochore pairs (red and blue lines) from each of the indicated cell types. Relative distance was calculated by measuring the separation between each kinetochore and one spindle pole. Images were collected every 5 seconds for control and Kif18A siRNA cells and every 2 seconds for EGFP-Kif18A and EGFP-Kif18A-mut cells. (B) Still frames of CENP-B fluorescence in cells used to derive the distance versus time plots shown in (A). Arrows indicate position of pole used for relative distance measurements. Red and blue dots are overlayed on kinetochores that were tracked to generate the red and blue traces in (A) respectively. Two-color images of EGFP-Kif18A or EGFP-Kif18A-mut (green) with mRFP-CENP-B (red) were taken immediately after time-lapse imaging of kinetochore movements was stopped. Scale bar is 5 μm. (C) Representative kymographs of CENP-B fluorescence from cells transfected with control siRNAs, Kif18A-specific siRNAs or EGFP-Kif18A. Vertical scale bars = 2 minutes; horizontal scale bars = 5 μm. (D) Histograms displaying average inter-kinetochore distances for sister kinetochore pairs in live cells. The mean ± SEM is indicated for each distribution and the mean position is marked by a vertical dotted line. “n” indicates the number kinetochore pairs tracked from 10 (control and Kif18A siRNA), 7 (EGFP-Kif18A) or 4 (EGFP-Kif18A-mut) cells. The average inter-kinetochore distances measured from Kif18A siRNA and EGFP-Kif18A expressing cells are significantly different from those measured in control siRNA treated cells (p = 1.0 × 10⁻⁴ and p = 0.02 respectively). Average inter-kinetochore distances for EGFP-Kif18A expressing cells are also significantly different from EGFP-Kif18A-mut expressing cells (p = 0.02). (E) Histograms displaying deviation from average position (DAP) calculations for the indicated cell types. The mean ± SEM is given for each distribution and the mean position is marked by a vertical dotted line. “n” indicates the number of kinetochores analyzed from the same data set used in (D). The DAPs for kinetochores in Kif18A-depleted cells and EGFP-Kif18A cells are significantly different from the DAP for kinetochores in control siRNA cells (p = 4.4 × 10⁻²² and 1.2 × 10⁻⁹ respectively). The DAP for EGFP-Kif18A kinetochores is also significantly different from the DAP for EGFP-Kif18A-mut kinetochores (p = 0.002). (F) Average DAP measurements for kinetochores on the periphery of the spindle (peripheral) and along the pole-to-pole axis (internal) from cells treated with control or Kif18A siRNAs or over-expressing EGFP-Kif18A. Error bars are SEM; “n” indicates the number of kinetochores from the data set used in (E). DAPs for peripheral and internal kinetochores are significantly different in control and Kif18A-depleted cells (p = 5.9 × 10⁻⁷ and p = 7.0 × 10⁻⁴ respectively) but not in EGFP-Kif18A cells (p = 0.75).
Figure 3. Kif18A’s effects on oscillations are not an indirect effect of changes in spindle length
(A) Images of live HeLa cells expressing Venus-centrin and EGFP-CENP-B (control and Kif18A siRNA) or EGFP-Kif18A. Spindle lengths were determined by measuring the distance between Venus-centrin foci (arrows) or EGFP-Kif18A spindle pole labeling (arrowheads). Scale bar is 5 μm. (B) Histograms of spindle lengths measured in live cells. The mean ± SEM is given for each distribution and the mean position is marked by a vertical dotted line. “n” indicates the number of cells analyzed. Spindle lengths in Kif18A-depleted and EGFP-Kif18A expressing cells are significantly different from those in control-depleted cells (p = 4.4 × 10⁻⁷ and 0.002 respectively). (C) Scatter plot of deviation from average position (DAP) measurements as a function of spindle length. Black circles = control siRNA, red triangles = Kif18A siRNA and green squares = EGFP-Kif18A. Lines represent regression fits to each data set.
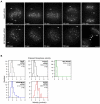
Figure 4. Kif18A regulates both the directional switch rate and velocity of kinetochore oscillations
(A) Histograms showing the distribution of kinetochore directional switch rates measured in control and Kif18A siRNA cells. The mean ± SEM is given for each distribution and the mean position is marked by a vertical dotted line. An average switch rate was calculated for each kinetochore and “n” indicates the number of kinetochores analyzed from 10 control and 10 Kif18A siRNA cells. The two data sets are significantly different (p = 2.8 × 10⁻⁵). (B) Histograms of average kinetochore velocities during oscillatory movements in control and Kif18A siRNA treated cells. The “oscillation velocity” distribution displays the average velocity for each kinetochore analyzed. “Poleward velocity” and “Away-from-Pole velocity” distributions include only velocities from movements made toward or away-from-the-pole that the kinetochore was attached to respectively. The mean ± SEM is given for each distribution and the mean position is marked by a vertical dotted line. “n” indicates the number of kinetochores analyzed from 5 control and 5 Kif18A siRNA cells. Kinetochore velocities in Kif18A-depleted cells are significantly different than those in control depleted cells (p = 2.8 × 10⁻¹⁵ for average oscillation velocity; p = 5.4 × 10⁻¹³ for poleward velocity; p = 4.2 × 10⁻¹² for away-from-pole velocity).
Figure 5. Kif18A affects poleward movement during anaphase
(A) Selected images from time-lapse analyses of Mad2-depleted and Kif18A/Mad2-co-depleted HeLa cells expressing EGFP-CENP-B and Venus-centrin. Time is given in seconds relative to anaphase sister kinetochore separation. Arrows mark the position of Venus-centrin labeled spindle poles. In both cells, the lower spindle pole is out of focus at the time of anaphase. Kinetochores on lagging chromosomes are marked by arrowheads. Cells were filmed at 5-second intervals; scale bar = 5 μm. (B) Histograms of anaphase A velocities measured in control siRNA, Mad2 siRNA, Kif18A/Mad2 siRNA, Kif18A siRNA and EGFP-Kif18A cells. The mean ± SEM is given for each distribution and the mean position is marked by a vertical dotted line. “n” indicates the number of kinetochores analyzed from 3 cells (Kif18A siRNA, Mad2 siRNA and Kif18A/Mad2 siRNA) or 4 cells (control siRNA and EGFP-Kif18A). The average anaphase A velocities in Kif18A-depleted, Kif18A/Mad2-co-depleted and EGFP-Kif18A expressing cells are significantly different from anaphase A velocities in control cells (p = 4.9 × 10⁻⁹, p = 4.0 × 10⁻³ and p = 4.4 × 10⁻¹⁶ respectively). Anaphase A velocities in Mad2-depleted and Kif18A/Mad2-co-depleted cells are also significantly different (p = 0.01).
Figure 6. Model for Kif18A regulation of mitotic chromosome movements
The concentration of Kif18A at kinetochores is proportional to kMT length and stability. Once Kif18A reaches a threshold level (dashed gray line) at kMT plus-ends, it increases the probability that the kMT will undergo catastrophe and therefore increases the probability that the kinetochore will change direction. In a control cell (gray diagonal lines) Kif18A restricts oscillatory movements to a region near the spindle equator where kMTs emanating from opposite poles are of relatively equal length (black bracket). Increasing the concentration of Kif18A in the cell by over-expressing EGFP-Kif18A (green diagonal lines) increases the accumulation of Kif18A on kMTs and further restricts movements (green bracket). Reducing the concentration of Kif18A by treating cells with Kif18A-specific siRNAs (red diagonal lines) prevents threshold accumulation of the motor and leads to larger kinetochore oscillations (red bracket).
Similar articles
- Kif18A and chromokinesins confine centromere movements via microtubule growth suppression and spatial control of kinetochore tension.
Stumpff J, Wagenbach M, Franck A, Asbury CL, Wordeman L. Stumpff J, et al. Dev Cell. 2012 May 15;22(5):1017-29. doi: 10.1016/j.devcel.2012.02.013. Dev Cell. 2012. PMID: 22595673 Free PMC article. - The human kinesin Kif18A is a motile microtubule depolymerase essential for chromosome congression.
Mayr MI, Hümmer S, Bormann J, Grüner T, Adio S, Woehlke G, Mayer TU. Mayr MI, et al. Curr Biol. 2007 Mar 20;17(6):488-98. doi: 10.1016/j.cub.2007.02.036. Epub 2007 Mar 8. Curr Biol. 2007. PMID: 17346968 - The kinesin-8 Kif18A dampens microtubule plus-end dynamics.
Du Y, English CA, Ohi R. Du Y, et al. Curr Biol. 2010 Feb 23;20(4):374-80. doi: 10.1016/j.cub.2009.12.049. Epub 2010 Feb 11. Curr Biol. 2010. PMID: 20153196 - Kinesin-8 molecular motors: putting the brakes on chromosome oscillations.
Gardner MK, Odde DJ, Bloom K. Gardner MK, et al. Trends Cell Biol. 2008 Jul;18(7):307-10. doi: 10.1016/j.tcb.2008.05.003. Epub 2008 May 29. Trends Cell Biol. 2008. PMID: 18513970 Free PMC article. Review. - Leaving no-one behind: how CENP-E facilitates chromosome alignment.
Craske B, Welburn JPI. Craske B, et al. Essays Biochem. 2020 Sep 4;64(2):313-324. doi: 10.1042/EBC20190073. Essays Biochem. 2020. PMID: 32347304 Free PMC article. Review.
Cited by
- Probing microtubule polymerisation state at single kinetochores during metaphase chromosome motion.
Armond JW, Vladimirou E, Erent M, McAinsh AD, Burroughs NJ. Armond JW, et al. J Cell Sci. 2015 May 15;128(10):1991-2001. doi: 10.1242/jcs.168682. Epub 2015 Apr 23. J Cell Sci. 2015. PMID: 25908867 Free PMC article. - Microtubule-sliding activity of a kinesin-8 promotes spindle assembly and spindle-length control.
Su X, Arellano-Santoyo H, Portran D, Gaillard J, Vantard M, Thery M, Pellman D. Su X, et al. Nat Cell Biol. 2013 Aug;15(8):948-57. doi: 10.1038/ncb2801. Epub 2013 Jul 14. Nat Cell Biol. 2013. PMID: 23851487 Free PMC article. - Identification of the KIF18A alpha-4 helix as a therapeutic target for chromosomally unstable tumor cells.
Schutt KL, Queen KA, Fisher K, Budington O, Mao W, Liu W, Gu X, Xiao Y, Aswad F, Joseph J, Stumpff J. Schutt KL, et al. Front Mol Biosci. 2024 Feb 12;11:1328077. doi: 10.3389/fmolb.2024.1328077. eCollection 2024. Front Mol Biosci. 2024. PMID: 38410188 Free PMC article. - A novel mode of capping protein-regulation by twinfilin.
Johnston AB, Hilton DM, McConnell P, Johnson B, Harris MT, Simone A, Amarasinghe GK, Cooper JA, Goode BL. Johnston AB, et al. Elife. 2018 Oct 23;7:e41313. doi: 10.7554/eLife.41313. Elife. 2018. PMID: 30351272 Free PMC article. - Pathogenic mutations in the chromokinesin KIF22 disrupt anaphase chromosome segregation.
Thompson AF, Blackburn PR, Arons NS, Stevens SN, Babovic-Vuksanovic D, Lian JB, Klee EW, Stumpff J. Thompson AF, et al. Elife. 2022 Jun 22;11:e78653. doi: 10.7554/eLife.78653. Elife. 2022. PMID: 35730929 Free PMC article.
References
- Ault JG, DeMarco AJ, Salmon ED, Rieder CL. Studies on the ejection properties of asters: astral microtubule turnover influences the oscillatory behavior and positioning of mono-oriented chromosomes. J Cell Sci. 1991;99(Pt 4):701–710. - PubMed
- Brinkley BR, Zinkowski RP, Mollon WL, Davis FM, Pisegna MA, Pershouse M, Rao PN. Movement and segregation of kinetochores experimentally detached from mammalian chromosomes. Nature. 1988;336:251–254. - PubMed
- Canman JC, Salmon ED, Fang G. Inducing precocious anaphase in cultured mammalian cells. Cell Motil Cytoskeleton. 2002;52:61–65. - PubMed
- Cassimeris L, Rieder CL, Salmon ED. Microtubule assembly and kinetochore directional instability in vertebrate monopolar spindles: implications for the mechanism of chromosome congression. J Cell Sci. 1994;107(Pt 1):285–297. - PubMed
Publication types
MeSH terms
Substances
Grants and funding
- GM778572/GM/NIGMS NIH HHS/United States
- GM69429/GM/NIGMS NIH HHS/United States
- GM066050/GM/NIGMS NIH HHS/United States
- R01 GM069429/GM/NIGMS NIH HHS/United States
- P50 GM066050/GM/NIGMS NIH HHS/United States
LinkOut - more resources
Full Text Sources
Other Literature Sources
Molecular Biology Databases
Research Materials


