Synapse elimination accompanies functional plasticity in hippocampal neurons - PubMed (original) (raw)
Comparative Study
. 2008 Feb 26;105(8):3123-7.
doi: 10.1073/pnas.0800027105. Epub 2008 Feb 19.
Affiliations
- PMID: 18287055
- PMCID: PMC2268595
- DOI: 10.1073/pnas.0800027105
Comparative Study
Synapse elimination accompanies functional plasticity in hippocampal neurons
Natalia Bastrikova et al. Proc Natl Acad Sci U S A. 2008.
Abstract
A critical component of nervous system development is synapse elimination during early postnatal life, a process known to depend on neuronal activity. Changes in synaptic strength in the form of long-term potentiation (LTP) and long-term depression (LTD) correlate with dendritic spine enlargement or shrinkage, respectively, but whether LTD can lead to an actual separation of the synaptic structures when the spine shrinks or is lost remains unknown. Here, we addressed this issue by using concurrent imaging and electrophysiological recording of live synapses. Slices of rat hippocampus were cultured on multielectrode arrays, and the neurons were labeled with genes encoding red or green fluorescent proteins to visualize presynaptic and postsynaptic neuronal processes, respectively. LTD-inducing stimulation led to a reduction in the synaptic green and red colocalization, and, in many cases, it induced a complete separation of the presynaptic bouton from the dendritic spine. This type of synapse loss was associated with smaller initial spine size and greater synaptic depression but not spine shrinkage during LTD. All cases of synapse separation were observed without an accompanying loss of the spine during this period. We suggest that repeated low-frequency stimulation simultaneous with LTD induction is capable of restructuring synaptic contacts. Future work with this model will be able to provide critical insight into the molecular mechanisms of activity- and experience-dependent refinement of brain circuitry during development.
Conflict of interest statement
The authors declare no conflict of interest.
Figures
Fig. 1.
Imaging synapses in hippocampal slice culture. (a–d) To allow for concurrent observation of putative synapses and electrophysiological recordings, neurons in hippocampal slice cultures were labeled with virally expressed fluorescent proteins (a Left) and cultured on multielectrode arrays (a Right). Putative en passant synapses were identified as the presence of a thickening in the presynaptic (red) axon (b, raw image, Upper Left) that apposed a postsynaptic (green) spine (b, raw image, Upper Right, and colored, Lower Left). (Scale bars, 1 μm.) (b Lower Right) Regions of interest (ROIs) were drawn around the presynaptic bouton (yellow outline and arrow) and the postsynaptic spine (blue outline and arrow) after examining all images in the Z stacks for possible interfering neighboring structures. Areas (pixels) of red/green colocalization were detected by the MetaMorph software and colored here in yellow (b Lower Right). Pixels of colocalization and spine area from each Z stack then were summed to give volume pixels (voxels). When the presynaptic axon could be traced back to an electrode site, as visualized in bright-field illumination (c), the axon was considered to be a candidate for stimulation. (Scale bar, 100 μm.) Cases where axons did not traverse near an electrode and those slices that had separated from the electrode array were designated as control (unstimulated) cases. Field potential recordings were made in the general area of the imaged synapses (c). To determine the frequency that best induced LTD in slices cultured on electrode arrays, 900 pulses were delivered at differing stimulation frequencies. Three-hertz afferent stimulation (short bar) was effective at inducing LTD, but 1-Hz stimulation (long bar) was not effective (d). The depression induced with 3 Hz was blocked with a 50 μM concentration of the NMDA receptor antagonist 2-amino-5-phosphonopentanoic acid (APV). (e) Schematic of a typical experimental design with a recording from one representative experiment. Baseline fEPSPs and images were taken for 1 h before LTD-inducing stimulation (900 pulses, 5 min of 3 Hz, indicated by the bars). The times that images were acquired are indicated by arrows. The stimulation was repeated up to four times (three in this case). Experiments were performed at 32°C.
Fig. 2.
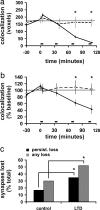
Colocalization of presynaptic and postsynaptic structures decreases after LTD. (a) Average red/green (presynaptic/postsynaptic) colocalization (voxels) over time is shown for both unstimulated control cases (n = 85, 85, 78, 74, 37, and 37 synapses from 14, 14, 13, 12, 4, and 4 slices for time points, respectively) and for cases in which LTD exceeded 15% (n = 77, 77, 70, 63, 27, and 15 synapses from 10, 10, 9, 8, 4, and 2 slices for time points, respectively). One pixel volume (voxel) is equivalent to 0.0007 μm3. Low-frequency stimulation (900 pulses at 3 Hz) is indicated by the bars. (b) Data from a expressed as a percentage of baseline values are shown. *, P < 0.01. (c) LTD-inducing stimulation enhanced both persistent and temporary loss of putative synapses. Only cases without loss during the baseline period are included. n = 64 unstimulated controls; n = 48 LTD; *, P < 0.05.
Fig. 3.
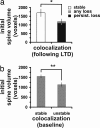
Small initial spine volume is associated with greater likelihood of synapse loss. (a) In stimulated cases in which LTD was induced, spines that were associated with synapses that were eventually lost had smaller initial volumes than spines that remained stable throughout the imaging period (*, P < 0.05). No significant difference was observed between spine volumes associated with either persistent loss of synapses or all types of synapse loss (persistent plus transient). (b) Some synapses separated during the baseline period and later reassociated (called “unstable” synapses). Compared with the spines with “stable” synapses, the spines with unstable synapses were smaller. **, P < 0.01.
Fig. 4.
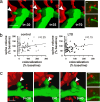
Synapse loss is not associated with decreases in spine volume. (a) Example of a persistent synapse loss after LTD with a reduction in spine volume. (b) Even though decreases in spine volumes were commonly observed coincident with synapse elimination (colocalization decreased to zero), the association was not significant. As represented by the symbols in the gray regions, many examples of synapse loss without decreases in spine volume were observed. Note that no complete spine losses were observed. In the LTD case, only synapses from slices in which LTD >15% was induced were included in this analysis (n = 76 synapses from 10 slices). For clarity of the graphs, x axes were truncated at 300% of the baseline colocalization. Arrowheads indicate the synaptic region of colocalization (a) or the postsynaptic spine (b). (c) An example of synapse elimination with no decrease in spine volume is shown. (Insets) Raw images from single Z stacks are shown with the pixels of colocalization pseudo-colored yellow before (Upper) and after (Lower) loss of colocalization (a Right and c Right). (Scale bars, 1 μm.)
Fig. 5.
Synapse elimination correlates with LTD expression. (a) The degree of synaptic depression, indicated as a percentage of the baseline field EPSP, is correlated with the degree of colocalization reduction (percentage of baseline value). Only synapses with stable baselines were included. (b) When the final level of LTD was used to classify cases, the percentages of synapses lost is significantly different between cases with large LTD and those with minimal LTD. Percentage baseline fEPSP of 86–150% equals no synaptic depression; 0–50% baseline equals maximal depression. **, P < 0.01, χ2 test. See also
SI Fig. 10
.
Similar articles
- Long-term depression-associated signaling is required for an in vitro model of NMDA receptor-dependent synapse pruning.
Henson MA, Tucker CJ, Zhao M, Dudek SM. Henson MA, et al. Neurobiol Learn Mem. 2017 Feb;138:39-53. doi: 10.1016/j.nlm.2016.10.013. Epub 2016 Oct 26. Neurobiol Learn Mem. 2017. PMID: 27794462 Free PMC article. - LTD, LTP, and the sliding threshold for long-term synaptic plasticity.
Stanton PK. Stanton PK. Hippocampus. 1996;6(1):35-42. doi: 10.1002/(SICI)1098-1063(1996)6:1<35::AID-HIPO7>3.0.CO;2-6. Hippocampus. 1996. PMID: 8878740 Review. - The N-methyl-D-aspartate receptor antagonist CPP alters synapse and spine structure and impairs long-term potentiation and long-term depression induced morphological plasticity in dentate gyrus of the awake rat.
Medvedev NI, Popov VI, Rodriguez Arellano JJ, Dallérac G, Davies HA, Gabbott PL, Laroche S, Kraev IV, Doyère V, Stewart MG. Medvedev NI, et al. Neuroscience. 2010 Feb 17;165(4):1170-81. doi: 10.1016/j.neuroscience.2009.11.047. Epub 2009 Dec 1. Neuroscience. 2010. PMID: 19961908 - Long-lasting synaptic loss after repeated induction of LTD: independence to the means of LTD induction.
Kamikubo Y, Egashira Y, Tanaka T, Shinoda Y, Tominaga-Yoshino K, Ogura A. Kamikubo Y, et al. Eur J Neurosci. 2006 Sep;24(6):1606-16. doi: 10.1111/j.1460-9568.2006.05032.x. Eur J Neurosci. 2006. PMID: 17004924 - Associative synaptic plasticity in hippocampus and visual cortex: cellular mechanisms and functional implications.
Debanne D. Debanne D. Rev Neurosci. 1996 Jan-Mar;7(1):29-46. doi: 10.1515/revneuro.1996.7.1.29. Rev Neurosci. 1996. PMID: 8736677 Review.
Cited by
- Noradrenergic refinement of glutamatergic neuronal circuits in the lateral superior olivary nucleus before hearing onset.
Hirao K, Eto K, Nakahata Y, Ishibashi H, Nagai T, Nabekura J. Hirao K, et al. J Neurophysiol. 2015 Sep;114(3):1974-86. doi: 10.1152/jn.00813.2014. Epub 2015 Jul 22. J Neurophysiol. 2015. PMID: 26203112 Free PMC article. - Temporally tuned neuronal differentiation supports the functional remodeling of a neuronal network in Drosophila.
Veverytsa L, Allan DW. Veverytsa L, et al. Proc Natl Acad Sci U S A. 2012 Mar 27;109(13):E748-56. doi: 10.1073/pnas.1114710109. Epub 2012 Mar 5. Proc Natl Acad Sci U S A. 2012. PMID: 22393011 Free PMC article. - Astrocytes contribute to synapse elimination via type 2 inositol 1,4,5-trisphosphate receptor-dependent release of ATP.
Yang J, Yang H, Liu Y, Li X, Qin L, Lou H, Duan S, Wang H. Yang J, et al. Elife. 2016 Apr 12;5:e15043. doi: 10.7554/eLife.15043. Elife. 2016. PMID: 27067238 Free PMC article. - Emerging Link between Alzheimer's Disease and Homeostatic Synaptic Plasticity.
Jang SS, Chung HJ. Jang SS, et al. Neural Plast. 2016;2016:7969272. doi: 10.1155/2016/7969272. Epub 2016 Feb 25. Neural Plast. 2016. PMID: 27019755 Free PMC article. Review. - Opposing Effects of Neuronal Activity on Structural Plasticity.
Fauth M, Tetzlaff C. Fauth M, et al. Front Neuroanat. 2016 Jun 28;10:75. doi: 10.3389/fnana.2016.00075. eCollection 2016. Front Neuroanat. 2016. PMID: 27445713 Free PMC article. Review.
References
- Hua JY, Smith SJ. Neural activity and the dynamics of central nervous system development. Nat Neurosci. 2004;7:327–332. - PubMed
- Hubel DH, Wiesel TN, LeVay S. Plasticity of ocular dominance columns in monkey striate cortex. Philos Trans R Soc London B Biol Sci. 1977;278:377–409. - PubMed
- Reiter HO, Waitzman DM, Stryker MP. Cortical activity blockade prevents ocular dominance plasticity in the kitten visual cortex. Exp Brain Res. 1986;65:182–188. - PubMed
- Kleinschmidt A, Bear MF, Singer W. Blockade of “NMDA” receptors disrupts experience-dependent plasticity of kitten striate cortex. Science. 1987;238:355–358. - PubMed
Publication types
MeSH terms
LinkOut - more resources
Full Text Sources
Other Literature Sources


