SAS-4 is recruited to a dynamic structure in newly forming centrioles that is stabilized by the gamma-tubulin-mediated addition of centriolar microtubules - PubMed (original) (raw)
SAS-4 is recruited to a dynamic structure in newly forming centrioles that is stabilized by the gamma-tubulin-mediated addition of centriolar microtubules
Alexander Dammermann et al. J Cell Biol. 2008.
Abstract
Centrioles are surrounded by pericentriolar material (PCM), which is proposed to promote new centriole assembly by concentrating gamma-tubulin. Here, we quantitatively monitor new centriole assembly in living Caenorhabditis elegans embryos, focusing on the conserved components SAS-4 and SAS-6. We show that SAS-4 and SAS-6 are coordinately recruited to the site of new centriole assembly and reach their maximum levels during S phase. Centriolar SAS-6 is subsequently reduced by a mechanism intrinsic to the early assembly pathway that does not require progression into mitosis. Centriolar SAS-4 remains in dynamic equilibrium with the cytoplasmic pool until late prophase, when it is stably incorporated in a step that requires gamma-tubulin and microtubule assembly. These results indicate that gamma-tubulin in the PCM stabilizes the nascent daughter centriole by promoting microtubule addition to its outer wall. Such a mechanism may help restrict new centriole assembly to the vicinity of preexisting parent centrioles that recruit PCM.
Figures
Figure 1.
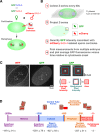
A method to monitor the recruitment of centriole components in vivo. (A) Schematic of the mating scheme used to monitor centriolar recruitment of GFP fusions. (B) Imaging and quantification flowchart. (C) A pair of representative images and schematic of the method used to measure the GFP intensity coincident with the RFP-labeled sperm centrioles. The regions corresponding to the two sperm centrioles in the low magnification images are indicated (white dashed boxes). A 5 × 5 pixel box (red) and a larger 7 × 7 pixel box (blue) were drawn around the peak RFP signal for each sperm centriole and GFP intensity was quantified as outlined. (D) Timeline of events between fertilization and onset of the first embryonic cytokinesis. Times for each event (n > 5 embryos) are in seconds relative to cytokinesis onset (t = 0) ± standard deviation. Schematics illustrate intermediates in centriole assembly based on ultrastructural work (Pelletier et al., 2006). After fertilization, the sperm-derived centrioles separate and by early S phase (∼−950 s), a small central tube ∼60 nm in length and 40 nm in diameter is present adjacent and perpendicular to each sperm-derived centriole. By early prophase, the central tube is ∼110 nm in length and 65 nm in diameter. Centriolar microtubules assemble during the second half of mitotic prophase (−450 to −250 s), and their assembly is complete by metaphase (−150 s).
Figure 2.
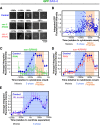
Kinetic profiles for SAS-6 recruitment in control, sas-5(RNAi), sas-4(RNAi), and HU-treated embryos. (A) High-resolution images of GFP:SAS-6 recruited to RFP-labeled sperm centrioles in embryos generated using the mating scheme in Fig. 1 A. Times (in seconds relative to cytokinesis onset) correspond to meiosis (−1,470 to −1,370 s), early (−1,180 to −1,156 s) and mid (−1,005 to −972 s) S phase, and late prophase (−281 to −267 s). (B) Normalized individual measurements of the integrated GFP:SAS-6 intensity coincident with sperm centriolar RFP signal (see Materials and methods for details on normalization). (C) Kinetic profiles for the recruitment of GFP:SAS-6 in control and sas-5(RNAi) embryos. Data points are the mean of the normalized GFP intensity measurements collected during the 200-s interval centered on that point. (D) Depletion of SAS-4 does not affect the kinetics of centriolar GFP:SAS-6 recruitment or loss. (E) Recruitment profile of centriolar GFP:SAS-6 in embryos treated with 75 mM HU. The profile was generated as in C and D except that sequences were time-aligned with respect to centriole separation, which occurs at the same time after meiosis II anaphase in control and HU-treated embryos (Videos 1 and 2, available at
http://www.jcb.org/cgi/content/full/jcb.200709102/DC1
). The control dataset plotted here is the same as in B–D except that the means were recalculated for the indicated 200-s intervals after converting seconds before cytokinesis onset to seconds after centriole separation. All error bars indicate the 90% confidence interval.
Figure 3.
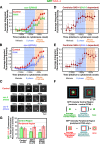
Deconvolving centriolar- and pericentriolar material–associated SAS-4 recruitment by comparison of control and sas-5/sas-6(RNAi) embryos. (A and B) Kinetic profiles for the recruitment of GFP:SAS-4 in control, sas-5(RNAi) (A), and sas-6(RNAi) (B) embryos. Data points are the mean of the normalized GFP intensity of measurements collected during the 200-s interval centered on that point. (C) High-resolution images of GFP:SAS-4 recruited to RFP-labeled sperm centrioles under the indicated conditions. Times (in seconds relative to cytokinesis onset) correspond to meiosis (−1,460 to −1,304 s), early (−1,204 to −1,163 s) and mid (−949 to −878 s) S phase, and late prophase (−400 to −260 s). Note that, although GFP:SAS-4 is not enriched at centrioles in SAS-5– or SAS-6–depleted embryos, it still accumulates in the PCM (arrowheads). Levels of centriolar GFP:SAS-4 were calculated by subtracting the PCM signal, measured in either sas-5(RNAi) (D) or sas-6(RNAi) (E) embryos, from the combined centriole and PCM signal measured in control embryos. (F) Outline of the method used to measure the distribution of GFP:SAS-4 within the centrosome. A pair of high-resolution images of prometaphase/metaphase centrosomes from embryos expressing GFP:γ-tubulin (left) or a GFP centriole marker (right) illustrate how the centrosome was partitioned into central and peripheral regions by concentric boxes. A 7 × 7 pixel central box (green) includes the signal from the centrioles as well as the central PCM, a larger 18 × 18 pixel box (red) includes the peripheral PCM, and the largest 30 × 30 pixel box (blue) was used to measure the background. (G) Depletion of SAS-5 or SAS-6 specifically affects centriolar recruitment of SAS-4. The distribution of GFP:SAS-4 within the centrosome was quantified in prometaphase/metaphase embryos, when PCM recruitment is maximal. Integrated GFP:SAS-4 fluorescence in the central and peripheral regions, expressed as a percentage of the mean total centrosomal fluorescence (central + peripheral) in control embryos, is plotted for the indicated conditions. Asterisks denote statistically significant differences relative to control (P < 0.05 by t test). All error bars indicate the 90% confidence interval.
Figure 4.
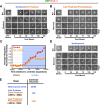
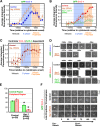
Centriolar SAS-4 is in dynamic equilibrium with the cytoplasmic pool during late S phase and early prophase but becomes stable to exchange in late prophase. (A and B) Three examples of centrosomes in GFP:SAS-4 embryos, generated as in Fig. 1 A, photobleached in S phase/early prophase (A; bleached at 693, 756, and 424 s before cytokinesis onset, from top to bottom, respectively) and late prophase/prometaphase (B; bleached at 120, 336, and 170 s before cytokinesis onset, from top to bottom, respectively). Times are in seconds after photobleaching. (C) Recruitment profile of centrosomal GFP:SAS-4 after HU treatment. Recruitment curves were generated after time-aligning the data points with respect to centriole separation as described in Fig. 2 E. Error bars indicate the 90% confidence interval. (D) Three examples of photobleached centrosomes in embryos arrested in S phase by HU treatment. Times are given in seconds after photobleaching. (E) Summary of fluorescence recovery after photobleaching analysis. Bars, 5 μm.
Figure 5.
γ-Tubulin is not required to recruit SAS-6 or SAS-4 to centrioles but is required for stable incorporation of SAS-4 during late prophase. (A) Kinetic profiles for recruitment of GFP:SAS-6 in γ-tubulin–depleted embryos (tbg-1[RNAi]) generated as described in Fig. 2 (B and C). (B) Kinetic profiles for the recruitment of GFP:SAS-4 in embryos depleted of γ-tubulin (tbg-1[RNAi]) or simultaneously depleted of γ-tubulin and SAS-5 (tbg-1,sas-5[RNAi]), generated as described in Fig. 3 A. (C) Levels of centriolar GFP:SAS-4 in γ-tubulin–depleted embryos, calculated by subtracting the GFP:SAS-4 signal in tbg-1,sas-5(RNAi) embryos from the combined centriole and PCM signal in tbg-1(RNAi) embryos, compared with centriolar GFP:SAS-4 in control embryos (control data are from Fig. 3 D). (D) High-resolution images of control and tbg-1(RNAi) embryos, generated by mating as in Fig. 1 A, expressing GFP:SAS-4 or GFP:SAS-6. Times (in seconds relative to cytokinesis onset) correspond to meiosis (−1,305 to −1,650 s), early (−1,166 to −1,002s) and mid (−698 to −482 s) S phase, and late prophase (−320 to −115 s). (E) Analysis of the central and peripheral GFP:SAS-4 signal in prometaphase/metaphase tbg-1(RNAi) embryos performed as in Fig. 3 F. Asterisks denote statistically significant differences relative to control (P < 0.05 by t test). (F) Two representative examples of photobleached centrosomes in late prophase/prometaphase control (top and bottom centrioles were bleached at 215 and 332 s before cytokinesis onset, respectively) or tbg-1(RNAi) (top and bottom centrioles were bleached at 321 and 32 5s before the onset of cortical contractility, respectively) embryos. Times are in seconds after photobleaching. All error bars indicate the 90% confidence interval. Bars, 5 μm.
Figure 6.
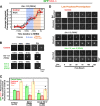
Microtubule assembly is not required to recruit SAS-4 to centrioles but is required for its stable incorporation during late prophase. (A) Kinetic profiles for recruitment of GFP:SAS-4 in embryos depleted of β-tubulin (tbb-1/2[RNAi]). Because tubulin-depleted embryos do not undergo cytokinesis, sequences were aligned relative to nuclear envelope breakdown, which occurs ∼257 s before cytokinesis onset in control embryos and with normal timing with respect to earlier events when microtubule assembly is inhibited (Portier et al., 2007). (B) High-resolution images of control, tbb-1/2(RNAi), and sas-5,tbb-1/2 (RNAi) embryos expressing GFP:SAS-4, generated by mating as described in Fig. 1 A. Times (in seconds relative to nuclear envelope breakdown), correspond to meiosis (−1,364 to −1,099s), early (−940 to −873 s) and mid (−686 to −593 s) S phase, and late prophase/prometaphase (−27 to +94 s). Note that, although GFP:SAS-4 is not enriched at centrioles in SAS-5,TBB-1/2–depleted embryos, it still accumulates in the PCM (arrowhead). (C) Analysis of the central and peripheral GFP:SAS-4 signal in control, tbb-1/2(RNAi), and sas-5,tbb-1/2 (RNAi) embryos in prometaphase performed as in Fig. 3 F. Asterisks denote statistically significant differences relative to control (P < 0.05 by t test). (D) Two representative examples each of photobleached centrosomes in late prophase/prometaphase from control, tbb-1/2(RNAi), and sas-5,tbb-1/2(RNAi) embryos. Times are in seconds after photobleaching. All error bars indicate the 90% confidence interval. Bars, 5 μm.
Figure 7.
Model relating the recruitment and dynamics of SAS-4 and SAS-6 to ultrastructural steps in the duplication cycle. (A) SAS-4 (red) is recruited to the central tube as it forms during S phase. Between late S phase and early prophase, centriolar SAS-4 is in dynamic equilibrium with the cytoplasmic pool but its levels remain constant. During late prophase, centriolar SAS-4 is stably incorporated into the outer centriole wall in a step that requires γ-tubulin and cell cycle progression into mitosis and likely corresponds to assembly of the centriolar microtubules. (B) Two models to explain the recruitment and subsequent reduction in the amount of SAS-6 at the site of new centriole assembly. In the first model (top), newly recruited SAS-6 is strictly associated with the daughter centriole. In this model, an SAS-6–containing structure forms during S phase and is subsequently reduced in size by half in a step that normally occurs in late prophase but does not require cell cycle progression into mitosis. In the second model (bottom), SAS-6 is recruited to the parent centriole before central tube formation. Subsequently, a portion of this SAS-6 is incorporated into the central tube of the daughter centriole. Assembly of the central tube triggers loss of the SAS-6 associated with the parent centriole that was not incorporated into the daughter.
Similar articles
- Interaction between the Caenorhabditis elegans centriolar protein SAS-5 and microtubules facilitates organelle assembly.
Bianchi S, Rogala KB, Dynes NJ, Hilbert M, Leidel SA, Steinmetz MO, Gönczy P, Vakonakis I. Bianchi S, et al. Mol Biol Cell. 2018 Mar 15;29(6):722-735. doi: 10.1091/mbc.E17-06-0412. Epub 2018 Jan 24. Mol Biol Cell. 2018. PMID: 29367435 Free PMC article. - Centriole assembly requires both centriolar and pericentriolar material proteins.
Dammermann A, Müller-Reichert T, Pelletier L, Habermann B, Desai A, Oegema K. Dammermann A, et al. Dev Cell. 2004 Dec;7(6):815-29. doi: 10.1016/j.devcel.2004.10.015. Dev Cell. 2004. PMID: 15572125 - Sequential protein recruitment in C. elegans centriole formation.
Delattre M, Canard C, Gönczy P. Delattre M, et al. Curr Biol. 2006 Sep 19;16(18):1844-9. doi: 10.1016/j.cub.2006.07.059. Curr Biol. 2006. PMID: 16979563 - Centrosome size is controlled by centriolar SAS-4.
Salisbury JL. Salisbury JL. Trends Cell Biol. 2003 Jul;13(7):340-3. doi: 10.1016/s0962-8924(03)00126-0. Trends Cell Biol. 2003. PMID: 12837604 Review. - Centriole assembly at a glance.
Gönczy P, Hatzopoulos GN. Gönczy P, et al. J Cell Sci. 2019 Feb 20;132(4):jcs228833. doi: 10.1242/jcs.228833. J Cell Sci. 2019. PMID: 30787112 Review.
Cited by
- Affinity purification of protein complexes in C. elegans.
Zanin E, Dumont J, Gassmann R, Cheeseman I, Maddox P, Bahmanyar S, Carvalho A, Niessen S, Yates JR 3rd, Oegema K, Desai A. Zanin E, et al. Methods Cell Biol. 2011;106:289-322. doi: 10.1016/B978-0-12-544172-8.00011-6. Methods Cell Biol. 2011. PMID: 22118282 Free PMC article. - Analysis of centriole elimination during C. elegans oogenesis.
Mikeladze-Dvali T, von Tobel L, Strnad P, Knott G, Leonhardt H, Schermelleh L, Gönczy P. Mikeladze-Dvali T, et al. Development. 2012 May;139(9):1670-9. doi: 10.1242/dev.075440. Development. 2012. PMID: 22492357 Free PMC article. - Multiple mechanisms contribute to centriole separation in C. elegans.
Cabral G, Sans SS, Cowan CR, Dammermann A. Cabral G, et al. Curr Biol. 2013 Jul 22;23(14):1380-7. doi: 10.1016/j.cub.2013.06.043. Curr Biol. 2013. PMID: 23885867 Free PMC article. - Caenorhabditis elegans centriolar protein SAS-6 forms a spiral that is consistent with imparting a ninefold symmetry.
Hilbert M, Erat MC, Hachet V, Guichard P, Blank ID, Flückiger I, Slater L, Lowe ED, Hatzopoulos GN, Steinmetz MO, Gönczy P, Vakonakis I. Hilbert M, et al. Proc Natl Acad Sci U S A. 2013 Jul 9;110(28):11373-8. doi: 10.1073/pnas.1302721110. Epub 2013 Jun 24. Proc Natl Acad Sci U S A. 2013. PMID: 23798409 Free PMC article. - Mitotic Cell Division in Caenorhabditis elegans.
Pintard L, Bowerman B. Pintard L, et al. Genetics. 2019 Jan;211(1):35-73. doi: 10.1534/genetics.118.301367. Genetics. 2019. PMID: 30626640 Free PMC article. Review.
References
- Azimzadeh, J., and M. Bornens. 2004. The Centrosome in Evolution. In Centrosomes in Development and Disease. E.A. Nigg, editor. Wiley-VCH, Weinheim, Germany. 93–122.
- Basto, R., J. Lau, T. Vinogradova, A. Gardiol, C.G. Woods, A. Khodjakov, and J.W. Raff. 2006. Flies without centrioles. Cell. 125:1375–1386. - PubMed
- Bettencourt-Dias, M., and D.M. Glover. 2007. Centrosome biogenesis and function: centrosomics brings new understanding. Nat. Rev. Mol. Cell Biol. 8:451–463. - PubMed
- Bettencourt-Dias, M., A. Rodrigues-Martins, L. Carpenter, M. Riparbelli, L. Lehmann, M.K. Gatt, N. Carmo, F. Balloux, G. Callaini, and D.M. Glover. 2005. SAK/PLK4 is required for centriole duplication and flagella development. Curr. Biol. 15:2199–2207. - PubMed
