The MHC class I peptide repertoire is molded by the transcriptome - PubMed (original) (raw)
The MHC class I peptide repertoire is molded by the transcriptome
Marie-Hélène Fortier et al. J Exp Med. 2008.
Abstract
Under steady-state conditions, major histocompatibility complex (MHC) I molecules are associated with self-peptides that are collectively referred to as the MHC class I peptide (MIP) repertoire. Very little is known about the genesis and molecular composition of the MIP repertoire. We developed a novel high-throughput mass spectrometry approach that yields an accurate definition of the nature and relative abundance of unlabeled peptides presented by MHC I molecules. We identified 189 and 196 MHC I-associated peptides from normal and neoplastic mouse thymocytes, respectively. By integrating our peptidomic data with global profiling of the transcriptome, we reached two conclusions. The MIP repertoire of primary mouse thymocytes is biased toward peptides derived from highly abundant transcripts and is enriched in peptides derived from cyclins/cyclin-dependent kinases and helicases. Furthermore, we found that approximately 25% of MHC I-associated peptides were differentially expressed on normal versus neoplastic thymocytes. Approximately half of those peptides are derived from molecules directly implicated in neoplastic transformation (e.g., components of the PI3K-AKT-mTOR pathway). In most cases, overexpression of MHC I peptides on cancer cells entailed posttranscriptional mechanisms. Our results show that high-throughput analysis and sequencing of MHC I-associated peptides yields unique insights into the genesis of the MIP repertoire in normal and neoplastic cells.
Figures
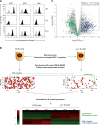
Figure 1.
Experimental design for identification and relative quantification of native unlabeled MHC I–associated peptides. (A) Cell surface MHC I expression on EL4 WT, β2m− mutant, and β2m+ transfectant cell lines. Cells were stained with antibodies against H2Db, H2Kb, and Qa2 (black) or the corresponding isotype control antibody (gray). (B) Peptides obtained by MAE were analyzed by on-line 2D-nanoLC-MS (three biological replicates for each cell population). Contour profiles of m/z versus retention time versus intensity were used to visualize differences between MS profiles (middle). A logarithmic intensity scale distinguishes between low (dark red) and highly (bright yellow) abundant species. Examples of peptides that were differentially expressed (blue line) or not (green line) between WT and β2m− EL4 cells are highlighted in boxes. (bottom) Heat map representation shows differential peptide expression between WT and β2m− EL4 cells where each horizontal line corresponds to a unique peptide cluster (n = 3,716). A logarithmic scale depicts peptides that are expressed at high (red) or low (green) level in each cell population. (C) Volcano plot representation showing reproducibly detected peptide ions across three replicate analyses. Peptide clusters (n = 1,236) highlighted in dashed box were considered as class I–restricted (P ≤ 0.05; fold change ≥ 5). Peptides that were sequenced by MS/MS are represented by colored dots: green for contaminants, and blue for MHC I–associated peptides.
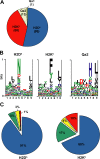
Figure 2.
Allelic distribution and binding scores of 178 MHC I–associated peptides eluted from EL4 cells. (A) Pie chart shows distribution of 178 MHC I–associated peptides eluted from EL4 cells. The smm, SYFPEITHI (H2Db and H2Kb), and Rankpep (Qa2) computational models were used to link individual peptides to MHC I allelic products. (B) Logo showing the profile motif for peptides presented by H2-Db, H2-Kb, and Qa2 molecules. Acidic (red), basic (blue), hydrophobic (black), and neutral (green) amino acids are illustrated. (C) Individual source proteins for peptides presented by H2Db and H2Kb (n = 164) were entered in the smm binding algorithm. We assessed the predicted MHC I binding affinity of all peptides contained in individual proteins. Pie charts show the proportion of peptides eluted from EL4 cells that ranked in the top 1% (blue), top 5% (green), top 10% (yellow), or below the 90th percentile of peptides (red).
Figure 3.
Discrimination between MHC I–associated peptides and contaminant peptides using bioinformatic tools. (A–E) For peptides eluted from EL4 cells, the y axis shows computed MHC binding scores determined with the smm (A and C), SYFPEITHI (B and D), and Rankpep (E) computational methods. The x axis cut at the selected binding thresholds. Each bar represents a sequenced peptide. Individual H2Db-, H2Kb-, and Qa2-associated peptides (red) and contaminant peptides (blue) were scored as illustrated.
Figure 4.
Analyses of genes and transcripts coding MHC I–associated peptides eluted from primary thymocytes. (A) GO term enrichment analysis of 189 genes coding MHC I peptides eluted from thymocytes. Exact P values and global false-discovery rates were <0.05 for each listed GO term. Values in parentheses indicate the fold enrichment relative to the whole mouse genome. (B) We compared the relative abundance of two sets of thymic transcripts using previously reported microarray data (50): mRNAs coding MHC I peptides eluted from primary thymocytes (red), and 36,182 thymus-derived transcripts (gray). Original mRNA expression data on the x axis were plotted on a log2 scale. The y axes represent the number of transcripts for each sample set. (C) Frequency distributions for the two sets of thymic transcripts defined in B were plotted using a bin increment of 0.2. Three distinct mRNA expression groups are shown (low-, medium-, and high-abundance mRNA). Graph shows the proportion of mRNAs with low- (black), medium- (red), and high- (blue) abundance among the two sets of transcripts. *, P < 0.05; **, P < 0.0001. (D) Predicted MHC binding score (determined with smm) for peptides whose mRNA are expressed at low, medium, or high level. Spearman linear correlation coefficient (r) was calculated for H2Kb- (dashed line; white squares) and H2Db-associated (solid line; black squares) peptides.
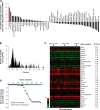
Figure 5.
Peptide source mRNAs expression patterns reveal an organ-specific signature in the MIP repertoire of thymocytes. (A) Comparison of normalized mean expression values (y axis) across 58 different tissues (x axis) including the thymus (red). Normalized mean expression values were calculated as follows: mean expression value from 180 peptide source genes/mean expression value of 36,182 transcripts for each particular tissue. Calculated values were ranked from left to right in a decreasing order. (B) Z scores were calculated for each of the 180 peptide source genes to identify transcripts preferentially expressed in the thymus. Graph shows frequency distributions of calculated z scores with a bin increment of 0.05. (C) Heat map shows the relative mRNA expression in 58 tissues of the 30 peptide source genes with highest thymic z scores. (D) High z score genes determine the thymus specificity of the gene set encoding MHC I–associated peptides. Genes preferentially overexpressed in the thymus (high thymic z scores; blue) were additively removed (x axis). Normalized mean expression values and thymus rank (y axis) were determined following removal of each individual gene. Removal of the 30 genes with a high thymic z score had a drastic impact on thymus rank. Removal of up to 70 randomly selected genes (100,000 permutations; green) had no significant impact on thymus rank.
Figure 6.
Relative quantification of differentially expressed MHC I peptides and source mRNAs from thymocytes and EL4 cells. (A) Volcano plot representation illustrates MHC I peptides reproducibly detected across biological replicates (n = 3). Peptides over- and underexpressed on EL4 cells relative to thymocytes (P ≤ 0.05; fold change ≥ 2.5) were highlighted in blue and red, respectively. MS/MS spectra of circled peptides are shown in B and C. (B and C) Illustration of two differentially expressed MHC I peptides. Reconstructed ion chromatograms show differential abundance for m/z 471.772+ (VAAANREVL) and 521.262+ (FGPVNHEEL) in EL4 cells versus thymocytes. MS/MS spectra confirm MHC I peptide sequences and the identification of the cognate source proteins. (D) Scatter plot shows the correlation between relative expression of mRNA and that of MHC I peptide. Expression ratios for source mRNA (x axis) and MHC I peptide (y axis) between EL4 cells and thymocytes were plotted on a log2 scale for 47 pairs. A Spearman correlation coefficient was calculated from the linear regression. MHC I peptides overexpressed in EL4 cells or normal thymocytes are highlighted in blue and red, respectively; peptides that were not differentially expressed are shown in gray. Dashed box shows peptides whose overexpression on EL4 cells did not correlate with increased mRNA levels of their source protein.
Figure 7.
Splenocytes primed against peptides overexpressed on EL4 cells selectively kill EL4 cells. Mice were immunized with DCs coated with STLTYSRM (A) or VAAANREVL (B) peptide. Splenocytes from primed mice were restimulated in vitro with the corresponding peptide for 6 d, and tested for in vitro cytotoxic activity against CFSE-labeled target cells (EL4 cells and primary mouse thymocytes) at different E/T ratios. Number of effectors represents the number of unfractionated splenocytes used in the cytotoxicity assay. Mice immunized with unloaded DCs were used as negative control. Data represent the mean ± the SD for four mice per group.
Similar articles
- Deletion of immunoproteasome subunits imprints on the transcriptome and has a broad impact on peptides presented by major histocompatibility complex I molecules.
de Verteuil D, Muratore-Schroeder TL, Granados DP, Fortier MH, Hardy MP, Bramoullé A, Caron E, Vincent K, Mader S, Lemieux S, Thibault P, Perreault C. de Verteuil D, et al. Mol Cell Proteomics. 2010 Sep;9(9):2034-47. doi: 10.1074/mcp.M900566-MCP200. Epub 2010 May 19. Mol Cell Proteomics. 2010. PMID: 20484733 Free PMC article. - Analysis of the structure of naturally processed peptides bound by class I and class II major histocompatibility complex molecules.
Appella E, Padlan EA, Hunt DF. Appella E, et al. EXS. 1995;73:105-19. doi: 10.1007/978-3-0348-9061-8_6. EXS. 1995. PMID: 7579970 Review. - Immunogenicity and tolerogenicity of self-major histocompatibility complex peptides.
Benichou G, Takizawa PA, Ho PT, Killion CC, Olson CA, McMillan M, Sercarz EE. Benichou G, et al. J Exp Med. 1990 Nov 1;172(5):1341-6. doi: 10.1084/jem.172.5.1341. J Exp Med. 1990. PMID: 1700053 Free PMC article. - Peptide presentation by class-I major histocompatibility complex molecules.
Nikolić-Zugić J, Carbone FR. Nikolić-Zugić J, et al. Immunol Res. 1991;10(1):54-65. doi: 10.1007/BF02918167. Immunol Res. 1991. PMID: 1865131 Review.
Cited by
- Association between HLA-C alleles and COVID-19 severity in a pilot study with a Spanish Mediterranean Caucasian cohort.
Vigón L, Galán M, Torres M, Martín-Galiano AJ, Rodríguez-Mora S, Mateos E, Corona M, Malo R, Navarro C, Murciano-Antón MA, García-Gutiérrez V, Planelles V, Martínez-Laso J, López-Huertas MR, Coiras M; Multidisciplinary Group of Study of COVID-19 (MGS-COVID). Vigón L, et al. PLoS One. 2022 Aug 12;17(8):e0272867. doi: 10.1371/journal.pone.0272867. eCollection 2022. PLoS One. 2022. PMID: 35960731 Free PMC article. - Higher throughput methods of identifying T cell epitopes for studying outcomes of altered antigen processing and presentation.
Newell EW. Newell EW. Front Immunol. 2013 Dec 5;4:430. doi: 10.3389/fimmu.2013.00430. Front Immunol. 2013. PMID: 24367368 Free PMC article. Review. - Critical Review of Existing MHC I Immunopeptidome Isolation Methods.
Kuznetsov A, Voronina A, Govorun V, Arapidi G. Kuznetsov A, et al. Molecules. 2020 Nov 19;25(22):5409. doi: 10.3390/molecules25225409. Molecules. 2020. PMID: 33228004 Free PMC article. Review. - STING activator c-di-GMP enhances the anti-tumor effects of peptide vaccines in melanoma-bearing mice.
Wang Z, Celis E. Wang Z, et al. Cancer Immunol Immunother. 2015 Aug;64(8):1057-66. doi: 10.1007/s00262-015-1713-5. Epub 2015 May 19. Cancer Immunol Immunother. 2015. PMID: 25986168 Free PMC article. - Pro-inflammatory Cytokines Alter the Immunopeptidome Landscape by Modulation of HLA-B Expression.
Javitt A, Barnea E, Kramer MP, Wolf-Levy H, Levin Y, Admon A, Merbl Y. Javitt A, et al. Front Immunol. 2019 Feb 18;10:141. doi: 10.3389/fimmu.2019.00141. eCollection 2019. Front Immunol. 2019. PMID: 30833945 Free PMC article.
References
- Rammensee, H.G., K. Falk, and O. Rotzschke. 1993. Peptides naturally presented by MHC class I molecules. Annu. Rev. Immunol. 11:213–244. - PubMed
- Yewdell, J.W., E. Reits, and J. Neefjes. 2003. Making sense of mass destruction: quantitating MHC class I antigen presentation. Nat. Rev. Immunol. 3:952–961. - PubMed
- Rock, K.L., I.A. York, T. Saric, and A.L. Goldberg. 2002. Protein degradation and the generation of MHC class I-presented peptides. Adv. Immunol. 80:1–70. - PubMed
- Heemels, M.T., and H. Ploegh. 1995. Generation, translocation, and presentation of MHC class I-restricted peptides. Annu. Rev. Biochem. 64:463–491. - PubMed
- Pamer, E., and P. Cresswell. 1998. Mechanisms of MHC class I–restricted antigen processing. Annu. Rev. Immunol. 16:323–358. - PubMed
Publication types
MeSH terms
Substances
LinkOut - more resources
Full Text Sources
Other Literature Sources
Molecular Biology Databases
Research Materials
Miscellaneous


