The recurrent SET-NUP214 fusion as a new HOXA activation mechanism in pediatric T-cell acute lymphoblastic leukemia - PubMed (original) (raw)
. 2008 May 1;111(9):4668-80.
doi: 10.1182/blood-2007-09-111872. Epub 2008 Feb 25.
Martine van Grotel, Joëlle Tchinda, Charles Lee, H Berna Beverloo, Peter J van der Spek, Andrew Stubbs, Jan Cools, Kyosuke Nagata, Maarten Fornerod, Jessica Buijs-Gladdines, Martin Horstmann, Elisabeth R van Wering, Jean Soulier, Rob Pieters, Jules P P Meijerink
Affiliations
- PMID: 18299449
- PMCID: PMC2343598
- DOI: 10.1182/blood-2007-09-111872
The recurrent SET-NUP214 fusion as a new HOXA activation mechanism in pediatric T-cell acute lymphoblastic leukemia
Pieter Van Vlierberghe et al. Blood. 2008.
Abstract
T-cell acute lymphoblastic leukemia (T-ALL) is mostly characterized by specific chromosomal abnormalities, some occurring in a mutually exclusive manner that possibly delineate specific T-ALL subgroups. One subgroup, including MLL-rearranged, CALM-AF10 or inv (7)(p15q34) patients, is characterized by elevated expression of HOXA genes. Using a gene expression-based clustering analysis of 67 T-ALL cases with recurrent molecular genetic abnormalities and 25 samples lacking apparent aberrations, we identified 5 new patients with elevated HOXA levels. Using microarray-based comparative genomic hybridization (array-CGH), a cryptic and recurrent deletion, del (9)(q34.11q34.13), was exclusively identified in 3 of these 5 patients. This deletion results in a conserved SET-NUP214 fusion product, which was also identified in the T-ALL cell line LOUCY. SET-NUP214 binds in the promoter regions of specific HOXA genes, where it interacts with CRM1 and DOT1L, which may transcriptionally activate specific members of the HOXA cluster. Targeted inhibition of SET-NUP214 by siRNA abolished expression of HOXA genes, inhibited proliferation, and induced differentiation in LOUCY but not in other T-ALL lines. We conclude that SET-NUP214 may contribute to the pathogenesis of T-ALL by enforcing T-cell differentiation arrest.
Figures
Figure 1
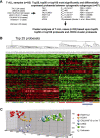
Gene expression profiles of 92 T-ALL patients. (A) Differentially expressed genes among the major molecular cytogenetic T-ALL subgroups (TAL1, LMO2, HOXA, HOX11/TLX1, and HOX11L2/TLX3; n = 67). The significance level (Wilcoxon P value) and FDR corrected P value for the top 100 genes in each T-ALL subgroup is indicated. TAL1, HOX11, and HOX11L2 subgroups show significant differentially expressedprobesets. (B) Cluster analysis of 92 patients with T-ALL (67 with known, 25 with unknown) based upon the top 25 most significant probesets for the TAL1, TAL1/LMO2, HOX11, and HOX11L2 subgroups combined with 15 HOXA probesets as previously described. (C) Principal component analyses shows clustering of the patients with unknown T-ALL along the molecular cytogenetic known patients: 1 _HOX11L2_-like, 19 _TAL1/LMO2_-like, and 5 _HOXA_-like patients.
Figure 2
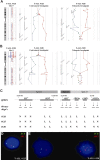
Submicroscopic del(9)(q34.11q34.13) in T-ALL. (A) Chromosome 9 ideogram and corresponding oligo array-CGH plots of test DNA–control DNA ratios (blue tracing) versus the dye-swap experiment (red tracing) for patient no. 126. Detailed analyses of the centromeric and telomeric breakpoints show involvement of SET and NUP214. (B) Similar array-CGH plot for patient no. 120. Centromeric and telomeric breakpoints show involvement of SET and ABL1. (C) Overview of oligoarray-CGH results in the potential breakpoint regions for 3 patients with T-ALL with del(9)(q34.11q34.13). The 60-mer oligonucleotide probes present on the array-CGH slide and located in the telomeric and centromeric breakpoint regions, as well as the specific genes located in this region with their transcription direction, are shown. Abbreviations: N; normal, L; loss. Dual-color FISH analysis of patient no. 125 (D) and no. 120 (E) using the LSI BCR-ABL ES translocation probe.
Figure 3
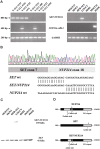
SET-NUP214 fusion transcript in T-ALL. (A) RT-PCR analysis using _SET_- and _NUP214_-specific primers and GAPDH primers as internal control, reveals a specific SET-NUP214 fusion gene in T-ALL patient nos. 125, 126, and 120; the patient with AUL; and the T-ALL cell line LOUCY. NUP214-ABL1 fusion was detected in patient nos. 120 and no.88 and in the T-ALL cell line PEER (B) Sequence analysis confirmed an identical fusion between exon 7 of SET and exon 18 of NUP214 in all SET-NUP214+ patients with T-ALL, the patient with AUL, and the LOUCY cell line. (C) Western blot analysis of T-ALL cell lines revealed a SET-NUP214 fusion in the cell line LOUCY. (D) At the protein level, the breakpoints are situated in the acidic tail of SET and the coiled-coil domain of NUP214.
Figure 4
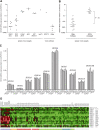
HOXA activation in SET-NUP214+ T-ALL. (A) Relative HOXA9 expression levels by RQ-PCR for _MLL_-rearranged, CALM-AF10+, inv(7)(p15q34), _TAL1_-, _LMO2_-, _HOX11L2_-, or _HOX11_-rearranged patients and T-ALL cell lines including LOUCY, MOLT13, SKW3, HPB-ALL, HSB2, and PEER. (B) Comparison of HOXA9 expression levels between the HOXA T-ALL subgroup (MLL, CALM-AF10, inv(7)(p15q34), and SET-NUP214; n = 10) and other T-ALL subgroups (TAL1, LMO2, HOX11L2, or HOX11). The horizontal lines represent the medians. (C) Relative expression levels of HOXA genes by RQ-PCR for the 3 SET-NUP214+ patients with T-ALL, the LOUCY cell line, the patient with AUL, and SKW3. (D) Heatmap of the 20 significant and differentially expressed probesets with a false discovery rate (FDR) lower than 5% for the HOXA cluster compared with the other patients with T-ALL.
Figure 5
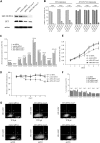
siRNA knockdown of SET and SET-NUP214 in the LOUCY T-ALL cell line. (A) SET expression using Western blot analysis 4 days after electroporation with the following conditions: no siRNA, control siRNA, siRNA SET exon 8, or siRNA SET exon 5. (B) Relative SET and SET-NUP214 expression by RQ-PCR after 2, 4, and 7 days for conditions as mentioned in panel A. (C) Relative expression of all members of the HOXA clusters by RQ-PCR (except for HOXA11 and HOXA13) after 4 days for conditions as mentioned in panel A. (D) Optical density (OD) values relative to control cells without pulse after 7 days for conditions as mentioned in panel A. (E) Total cell numbers after 7 days for conditions as mentioned in panel A. (F) Percentage of cell death relative to control cells without pulse after 7 days for conditions as mentioned in panel A. Error bars visualize the standard error of the mean (SEM). (G) FACS analysis 6 days after electroporation with either no siRNA, siRNA SET exon 8, or siRNA SET exon 5 for TCRγδ and membrane CD3. The percentage of cells positive for TCRγδ or mCD3 expression are visualized in quadrant 4.
Figure 6
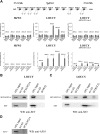
ChIP and coIP analysis of T-ALL cell lines LOUCY and SKW3. (A) ChIP analysis of SKW3, LOUCY, and LOUCY 4 days after electroporation with siRNA SET exon 5, for promoter sequences of HOXA1, HOXA3, HOXA9, HOXA10, and HOXA11. The amount of bound DNA was calculated relative to the 5% input DNA in anti-NUP214 and anti-acetyl histone H3 immunoprecipitates, whereas no antibody and anti-FLAG immunoprecipitates were used as negative control. Error bars represent SEM. (B) Western blot analysis of NUP214 and PP32 immunoprecipitates of the cell line LOUCY using anti-SET. (C) Similar Western blot analysis as in panel B for CRM1 and DOT1L immunoprecipitates in LOUCY. (D) Western blot analysis of NUP214 immunoprecipitates of the cell line LOUCY using anti-AF10.
Similar articles
- SET-NUP214 fusion in acute myeloid leukemia- and T-cell acute lymphoblastic leukemia-derived cell lines.
Quentmeier H, Schneider B, Röhrs S, Romani J, Zaborski M, Macleod RA, Drexler HG. Quentmeier H, et al. J Hematol Oncol. 2009 Jan 23;2:3. doi: 10.1186/1756-8722-2-3. J Hematol Oncol. 2009. PMID: 19166587 Free PMC article. - The characteristics and prognostic significance of the SET-CAN/NUP214 fusion gene in hematological malignancies: A systematic review.
Wang J, Zhan QR, Lu XX, Zhang LJ, Wang XX, Zhang HY. Wang J, et al. Medicine (Baltimore). 2022 Jul 29;101(30):e29294. doi: 10.1097/MD.0000000000029294. Medicine (Baltimore). 2022. PMID: 35905214 Free PMC article. - [Expression of SET-NUP214 fusion gene in patients with T-cell acute lymphoblastic leukemia and its clinical significance].
Dai HP, Wang Q, Wu LL, Ping NN, Wu CX, Xie JD, Pan JL, Xue YQ, Wu DP, Chen SN. Dai HP, et al. Zhongguo Shi Yan Xue Ye Xue Za Zhi. 2012 Oct;20(5):1047-51. Zhongguo Shi Yan Xue Ye Xue Za Zhi. 2012. PMID: 23114116 Chinese. - _DEK-NUP214_-Fusion Identified by RNA-Sequencing of an Acute Myeloid Leukemia with t(9;12)(q34;q15).
Panagopoulos I, Gorunova L, Torkildsen S, Tjønnfjord GE, Micci F, Heim S. Panagopoulos I, et al. Cancer Genomics Proteomics. 2017 Nov-Dec;14(6):437-443. doi: 10.21873/cgp.20053. Cancer Genomics Proteomics. 2017. PMID: 29109093 Free PMC article. Review. - T-cell acute lymphoblastic leukemia associated with complex karyotype and SET-NUP214 rearrangement: a case study and review of the literature.
Lee SG, Park TS, Cho SY, Lim G, Park GJ, Oh SH, Cho EH, Chong SY, Huh JY. Lee SG, et al. Ann Clin Lab Sci. 2011 Summer;41(3):267-72. Ann Clin Lab Sci. 2011. PMID: 22075511 Review.
Cited by
- The NOTCH signaling pathway: role in the pathogenesis of T-cell acute lymphoblastic leukemia and implication for therapy.
Tosello V, Ferrando AA. Tosello V, et al. Ther Adv Hematol. 2013 Jun;4(3):199-210. doi: 10.1177/2040620712471368. Ther Adv Hematol. 2013. PMID: 23730497 Free PMC article. - SET-CAN Fusion Gene in Acute Leukemia and Myeloid Neoplasms: Report of Three Cases and a Literature Review.
Zhang H, Zhang L, Li Y, Gu H, Wang X. Zhang H, et al. Onco Targets Ther. 2020 Aug 3;13:7665-7681. doi: 10.2147/OTT.S258365. eCollection 2020. Onco Targets Ther. 2020. PMID: 32821125 Free PMC article. - Novel-and Not So Novel-Inhibitors of the Multifunctional CRM1 Protein.
Aumann WK, Kazi R, Harrington AM, Wechsler DS. Aumann WK, et al. Oncol Rev. 2024 Aug 5;18:1427497. doi: 10.3389/or.2024.1427497. eCollection 2024. Oncol Rev. 2024. PMID: 39161560 Free PMC article. Review. - CCI-007, a novel small molecule with cytotoxic activity against infant leukemia with MLL rearrangements.
Somers K, Chudakova DA, Middlemiss SM, Wen VW, Clifton M, Kwek A, Liu B, Mayoh C, Bongers A, Karsa M, Pan S, Cruikshank S, Scandlyn M, Hoang W, Imamura T, Kees UR, Gudkov AV, Chernova OB, Haber M, Norris MD, Henderson MJ. Somers K, et al. Oncotarget. 2016 Jul 19;7(29):46067-46087. doi: 10.18632/oncotarget.10022. Oncotarget. 2016. PMID: 27317766 Free PMC article. - The Oncogenic Fusion Proteins SET-Nup214 and Sequestosome-1 (SQSTM1)-Nup214 Form Dynamic Nuclear Bodies and Differentially Affect Nuclear Protein and Poly(A)+ RNA Export.
Port SA, Mendes A, Valkova C, Spillner C, Fahrenkrog B, Kaether C, Kehlenbach RH. Port SA, et al. J Biol Chem. 2016 Oct 28;291(44):23068-23083. doi: 10.1074/jbc.M116.735340. Epub 2016 Sep 9. J Biol Chem. 2016. PMID: 27613868 Free PMC article.
References
- Pui CH, Relling MV, Downing JR. Acute lymphoblastic leukemia. N Engl J Med. 2004;350:1535–1548. - PubMed
- Clappier E, Cuccuini W, Kalota A, et al. The C-MYB locus is involved in chromosomal translocation and genomic duplications in human T-cell acute leukemia (T-ALL), the translocation defining a new T-ALL subtype in very young children. Blood. 2007;110:1251–1261. - PubMed
- Armstrong SA, Look AT. Molecular genetics of acute lymphoblastic leukemia. J Clin Oncol. 2005;23:6306–6315. - PubMed
- De Keersmaecker K, Marynen P, Cools J. Genetic insights in the pathogenesis of T-cell acute lymphoblastic leukemia. Haematologica. 2005;90:1116–1127. - PubMed
- Grabher C, von Boehmer H, Look AT. Notch 1 activation in the molecular pathogenesis of T-cell acute lymphoblastic leukaemia. Nat Rev Cancer. 2006;6:347–359. - PubMed
Publication types
MeSH terms
Substances
LinkOut - more resources
Full Text Sources
Molecular Biology Databases
