Stathmin activity influences sarcoma cell shape, motility, and metastatic potential - PubMed (original) (raw)
. 2008 May;19(5):2003-13.
doi: 10.1091/mbc.e07-09-0894. Epub 2008 Feb 27.
Milena S Nicoloso, Monica Schiappacassi, Stefania Berton, Francesca Lovat, Katarina Wolf, Vincenzo Canzonieri, Sara D'Andrea, Antonella Zucchetto, Peter Friedl, Alfonso Colombatti, Gustavo Baldassarre
Affiliations
- PMID: 18305103
- PMCID: PMC2366875
- DOI: 10.1091/mbc.e07-09-0894
Stathmin activity influences sarcoma cell shape, motility, and metastatic potential
Barbara Belletti et al. Mol Biol Cell. 2008 May.
Abstract
The balanced activity of microtubule-stabilizing and -destabilizing proteins determines the extent of microtubule dynamics, which is implicated in many cellular processes, including adhesion, migration, and morphology. Among the destabilizing proteins, stathmin is overexpressed in different human malignancies and has been recently linked to the regulation of cell motility. The observation that stathmin was overexpressed in human recurrent and metastatic sarcomas prompted us to investigate stathmin contribution to tumor local invasiveness and distant dissemination. We found that stathmin stimulated cell motility in and through the extracellular matrix (ECM) in vitro and increased the metastatic potential of sarcoma cells in vivo. On contact with the ECM, stathmin was negatively regulated by phosphorylation. Accordingly, a less phosphorylable stathmin point mutant impaired ECM-induced microtubule stabilization and conferred a higher invasive potential, inducing a rounded cell shape coupled with amoeboid-like motility in three-dimensional matrices. Our results indicate that stathmin plays a significant role in tumor metastasis formation, a finding that could lead to exploitation of stathmin as a target of new antimetastatic drugs.
Figures
Figure 1.
Stathmin is overexpressed in recurrent and metastatic sarcomas. (A) Western blot analysis of stathmin expression in malignant fibrohistiocytomas (T, left panels) or leiomyosarcomas (T, right panels) and their paired normal (N) tissues. Actin expression was used as normalization control. (B) Western blot analysis of stathmin and actin expression in primary and recurrent/metastatic sarcomas. (C) Statistical analysis of the stathmin/actin ratio in normal, primary, recurrent, and metastatic sarcoma samples, evaluated by densitometric scanning of the Western blots. The median ratio for each group is reported. (D) pS16 and total stathmin expression in seven patients (Pt) with relapsed local (R) or metastatic (M) diseases. Actin expression was used as normalization control. The ratio between pS16 and stathmin expression, evaluated by densitometric scanning of the blots, is illustrated in the bottom graphs. P, primary sarcoma; *not detectable.
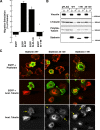
Figure 2.
Stathmin tubulin-sequestering activity is necessary to stimulate cell motility. (A) Migration through FN-coated FluoroBloks of HT-1080 cells transiently transfected with the indicated EGFP vectors. Data are expressed as the percentage of stimulation with respect to the surrounding untransfected cells and represent the mean (±SD) of three independent experiments, in which at least 100 transfected cells were counted. (B) Western blot analysis of soluble (S) and polymerized (P) fractions of tubulin in HT-1080 cells transiently transfected with the indicated pFLAG-vectors and adhered to FN for 60 min. The expression of vinculin (loading control), β-tubulin, polyglutamylated-tubulin, and stathmin is shown. (C) Confocal images of HT-1080 cells transiently transfected with the indicated EGFP constructs (green) and stained with phalloidin or acetylated tubulin (red). In the bottom panels, only the acetylated tubulin staining is shown. Yellow arrows indicate the transfected cells.
Figure 3.
Stathmin is phosphorylated in an adhesion-dependent manner. (A) Expression of endogenous stathmin pS16 and pS38 in HT-1080 cells, serum starved for 8 h (S) or adherent to FN for 60 min (FN). (B) Expression of stathmin pS16, pS25, and pS38 in HT-1080 cells, transiently transfected with pFLAG-stathmin, serum starved for 8 h, and adhered to FN for the indicated times. Vinculin expression was used as loading control. (C) Expression of pS16, pS25, and pS38-stathmin in HT-1080 cells, transiently transfected with FLAG-stathminWT or FLAG-stathminQ18E, serum starved for 8 h (S), or adhered to FN for 60 min (FN). (D) Endogenous stathmin is phosphorylated on S16 in an adhesion-dependent manner. S16 phosphorylation was detected using the phosphospecific Ab against pS16 and a secondary FITC-conjugated anti-rabbit Ab pseudocolored in green; total stathmin expression was detected using a monoclonal Ab against human stathmin (Transduction Laboratories) and a secondary anti-mouse AlexaFluor 633-conjugated Ab and pseudocolored in red; nuclei were detected using propidium iodide and pseudocolored in blue. In the left panel, the pS16 stathmin phosphorylation is specifically detected in a mitotic cell (yellow arrow). In the right panel, the S16 phosphorylation of the endogenous stathmin upon cell adhesion to FN for 60 min is shown. Yellow color indicates the colocalization of green and red fluorescence.
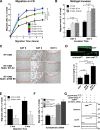
Figure 4.
StathminWT and stathminQ18E in HT-1080 cells confer a migratory advantage in ECM-mediated motility assays. (A) Migration of HT-1080 cell clones through FN-coated FluoroBloks, expressed as a function of time. Data represent the mean (±SD) of three independent experiments, performed in duplicate. (B) Invasion of HT-1080 cell clones through Matrigel-coated FluoroBloks, expressed as a function of time. Data represent the mean (±SD) of three independent experiments, performed in duplicate. (C) Matrigel evasion assay. HT-1080 cell clones were included in a Matrigel drop and allowed to evade for 5 d. A typical image from two independent experiments performed in quintuplicate is shown. The red line indicates the border of Matrigel drops. Bar, 100 μm. (D) Invasion depth expressed in micrometers, evaluated by confocal microscopy and representing the mean (±SD) of three independent experiments. Only cells detached from the basal layer were considered as invading cells. Significance was calculated using Student's t test. The top images show a typical computer reconstruction of HT-1080 cells, transiently transfected with the indicated EGFP vectors, invading a thick layer of Matrigel. Cells were plated on top of the Matrigel layer and allowed to invade in the presence of NIH-3T3 fibroblast-conditioned medium for 3 d. (E) Migration through FN-coated FluoroBloks of HT-1080 cells infected with the indicated Ads, expressed as a function of time. Data represent the mean (±SD) of two independent experiments, performed in duplicate. (F) Migration through FN-coated FluoroBloks of HT-1080 cells infected with Ad-stathmin siRNA at MOI 300 and then transfected with the indicated EGFP vectors. Percentage of EGFP-negative and -positive migrated cells is reported. Data represent the mean (±SD) of two independent experiments, performed in duplicate. (G) Western blot analysis of endogenous (stathmin) or ectopic (EGFP) stathmin expression in HT-1080 cells, infected with Ad-stathmin siRNA and then transfected with the indicated EGFP vectors. Vinculin expression was used as loading control.
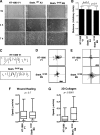
Figure 5.
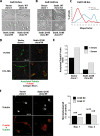
Stathmin expression exerts different effects on HT-1080 cells motility in 2D and 3D assays. (A) Typical images of HT-1080 V1, stathminWT A3, and stathminQ18E B9 clones during a wound-healing assay, in which the scratch was performed with a yellow tip. Bar, 100 μm. (B) Quantification of the migration distance covered by HT-1080 V1, stathminWT A3, and stathminQ18E B9 clones, over a 24-h period. (C–E) Orthotopically projected cell paths of HT-1080 cell clones, V1 (empty vector), and stathminQ18E clone B9, allowed to move toward a wound (C), randomly as sparse cells in 2D (D) or immersed in a 3D Coll I matrix (E), in serum-free medium. (F and G) Statistical evaluation (Mann-Whitney U test) of cell speed from experiments described in C and E. Median speeds were 0.07 and 0.09 μm/min for HT-1080 V1 and stathminQ18E B9, respectively, in the wound-healing assay (p = 0.7, Mann-Whitney U test) and 0.03 and 0.11 μm/min for HT-1080 V1 and stathminQ18E B9, respectively, in the 3D Coll I assay (p < 0.0001, Mann-Whitney U test).
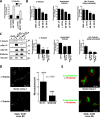
Figure 6.
Stathmin expression alters adhesion-dependent MT stabilization in HT-1080 cells. (A) Quantification of the polymerized fraction of β-tubulin in HT-1080 stathminWT clone D4 and stathminQ18E clone F7, harvested in suspension (Susp) or after adhesion to FN for 2 h (FN) and analyzed for their soluble (S) or polymerized (P) protein fractions. (B) Percentage of polymerized fractions of β-tubulin, acetylated-tubulin, and detyrosinated (Glu-tub) tubulin, in HT-1080 clone V1 and stathminQ18E clones B9 and F7, adhered to FN for 60 min. Data determined by densitometric scanning of the blots represents the means (±SD) of three independent experiments. (C) Western blot analysis of HT-1080 cells transiently transfected with pFLAG, pFLAG-stathminWT, and pFLAG-stathminQ18E vectors, adhered to FN for 60 min and analyzed for their soluble (S) or polymerized (P) protein fractions. The expressions of β-tubulin, pS16-, pS38, pan-stathmin, and vinculin are shown. Quantification of the polymerized fraction of the indicated cytoskeleton proteins determined by densitometric scanning of the blots is shown in the graphs and represents the mean (±SD) of three independent experiments. (D) Typical images of HT-1080 V1 and stathminQ18E B9 cell clones, adhered to FN for 1 h, subjected to the tubulin dilution assay and stained with anti-α-tubulin FITC-conjugated Ab. In the graph, the quantification of detectable MTs per cell, representing the mean of two independent experiments, is reported. Data are expressed as percent of MT number with respect to control cells; n represents the number of analyzed cells. (E) Immunofluorescence analysis of acetylated-tubulin (green) expression in HT-1080 clone V1 and stathminQ18E clone B9 grown on plastic dishes. Phalloidin staining of the same cells is shown in red.
Figure 7.
StathminQ18E expression alters HT-1080 cell morphology in 3D matrices. (A) Hoffman microscopy images of HT-1080 cell clones included in 3D Coll I and cultured in serum-reduced (1% FBS) medium for 6 h. Bar, 30 μm. (B) Phase-contrast microscopy images of HT-1080 cell clones immersed in 3D Coll I and cultured in serum-reduced medium for 24 h. Bar, 30 μm. (C) Assessment of the “Shape Factor” of HT-1080 V1 and stathminQ18E B9 clones included in 3D Coll I and cultured in serum-reduced medium for 24 h. The Shape Factor was calculated using the formula 4πA/P2. (D) Confocal microscopy analysis of HT-1080 cell clones vector 1 and stathminQ18E B9 immersed in Coll I, cultured in the indicated media (1% FBS or 10% FBS) for 24 h and stained for acetylated tubulin (green) and F-actin (red). Collagen fibers were visualized in gray using the Laser 488 reflection. (E) Quantification of the mean fluorescence intensity of acetylated tubulin and F-actin, expressed as the acetylated tubulin/F-actin ratio. Data represent the means of at least 50 cells for each condition, analyzed by confocal microscopy coupled with computer software analysis (p < 0.001 of V1 vs. B9 cells, using Student's t test). (F) Typical images of HT-1080 V1 and stathminQ18E B9 cell clones included in 3D Coll I and subjected to the tubulin dilution assay and stained with anti α-tubulin FITC-conjugated Ab and AlexaFluor543-phalloidin. Tubulin staining is shown in gray in the top panels and in green in the bottom panels. Phalloidin staining is in red. The graph shows the quantification of detectable MTs per cell in stathminQ18E-expressing cells in two independent experiments. Data are expressed as percent of MT number with respect to control cells; n represents the number of analyzed cells.
Figure 8.
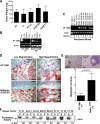
Stathmin expression enhances HT-1080 cell invasion and metastasis formation in vivo. (A) In vivo growth of parental and stably transfected HT-1080 cell clones subcutaneously injected in nude mice. (B) RT-PCR analysis of RNA of tissues explanted from mice injected with HT-1080 V1 and stathminQ18E B9 cell clones. Amplification was performed using primers designed on the transfected vectors. Amplification of actin was used as a control. (C) RT-PCR analysis of RNA extracted from blood derived from mice subcutaneously injected with HT-1080 cell clones, using primers designed on the transfected vectors. Amplification of actin was used as a control. (D) Local invasion of HT-1080 cells included in Matrigel and then injected subcutaneously into nude mice (n = 4). Fifteen days after the injection, tumors were explanted and analyzed by H&E staining. Typical images acquired at 10× (left panels) or 40× (right panels) are shown. (E) Lung metastasis formation in mice injected in the tail vein with HT-1080 V1 or stathminQ18E F7 cell clones and analyzed by H&E staining 30 d after the injection. The quantification of lung metastases in mice injected with HT-1080 V1 or stathminQ18E F7 cell clones is shown in the graph. (F) Analysis of soluble and polymerized acetylated tubulin content in tumors derived from the indicated HT-1080 cell clones. Percentage of polymerized fractions (% Pol.) of acetylated tubulin was calculated as described above.
Similar articles
- p27(Kip1)-stathmin interaction influences sarcoma cell migration and invasion.
Baldassarre G, Belletti B, Nicoloso MS, Schiappacassi M, Vecchione A, Spessotto P, Morrione A, Canzonieri V, Colombatti A. Baldassarre G, et al. Cancer Cell. 2005 Jan;7(1):51-63. doi: 10.1016/j.ccr.2004.11.025. Cancer Cell. 2005. PMID: 15652749 - Siva1 suppresses epithelial-mesenchymal transition and metastasis of tumor cells by inhibiting stathmin and stabilizing microtubules.
Li N, Jiang P, Du W, Wu Z, Li C, Qiao M, Yang X, Wu M. Li N, et al. Proc Natl Acad Sci U S A. 2011 Aug 2;108(31):12851-6. doi: 10.1073/pnas.1017372108. Epub 2011 Jul 18. Proc Natl Acad Sci U S A. 2011. PMID: 21768358 Free PMC article. - p27kip1 controls cell morphology and motility by regulating microtubule-dependent lipid raft recycling.
Belletti B, Pellizzari I, Berton S, Fabris L, Wolf K, Lovat F, Schiappacassi M, D'Andrea S, Nicoloso MS, Lovisa S, Sonego M, Defilippi P, Vecchione A, Colombatti A, Friedl P, Baldassarre G. Belletti B, et al. Mol Cell Biol. 2010 May;30(9):2229-40. doi: 10.1128/MCB.00723-09. Epub 2010 Mar 1. Mol Cell Biol. 2010. PMID: 20194624 Free PMC article. - Stathmin: a protein with many tasks. New biomarker and potential target in cancer.
Belletti B, Baldassarre G. Belletti B, et al. Expert Opin Ther Targets. 2011 Nov;15(11):1249-66. doi: 10.1517/14728222.2011.620951. Epub 2011 Oct 7. Expert Opin Ther Targets. 2011. PMID: 21978024 Review. - Stathmin destabilizing microtubule dynamics promotes malignant potential in cancer cells by epithelial-mesenchymal transition.
Lu Y, Liu C, Xu YF, Cheng H, Shi S, Wu CT, Yu XJ. Lu Y, et al. Hepatobiliary Pancreat Dis Int. 2014 Aug;13(4):386-94. doi: 10.1016/s1499-3872(14)60038-2. Hepatobiliary Pancreat Dis Int. 2014. PMID: 25100123 Review.
Cited by
- p27kip1 expression limits H-Ras-driven transformation and tumorigenesis by both canonical and non-canonical mechanisms.
Pellizzari I, Fabris L, Berton S, Segatto I, Citron F, D'Andrea S, Cusan M, Benevol S, Perin T, Massarut S, Canzonieri V, Schiappacassi M, Belletti B, Baldassarre G. Pellizzari I, et al. Oncotarget. 2016 Oct 4;7(40):64560-64574. doi: 10.18632/oncotarget.11656. Oncotarget. 2016. PMID: 27579539 Free PMC article. - Regulation of microtubule dynamics by DIAPH3 influences amoeboid tumor cell mechanics and sensitivity to taxanes.
Morley S, You S, Pollan S, Choi J, Zhou B, Hager MH, Steadman K, Spinelli C, Rajendran K, Gertych A, Kim J, Adam RM, Yang W, Krishnan R, Knudsen BS, Di Vizio D, Freeman MR. Morley S, et al. Sci Rep. 2015 Jul 16;5:12136. doi: 10.1038/srep12136. Sci Rep. 2015. PMID: 26179371 Free PMC article. - Cell migration through three-dimensional confining pores: speed accelerations by deformation and recoil of the nucleus.
Krause M, Yang FW, Te Lindert M, Isermann P, Schepens J, Maas RJA, Venkataraman C, Lammerding J, Madzvamuse A, Hendriks W, Te Riet J, Wolf K. Krause M, et al. Philos Trans R Soc Lond B Biol Sci. 2019 Aug 19;374(1779):20180225. doi: 10.1098/rstb.2018.0225. Epub 2019 Jul 1. Philos Trans R Soc Lond B Biol Sci. 2019. PMID: 31431171 Free PMC article. - Initial steps of metastasis: cell invasion and endothelial transmigration.
van Zijl F, Krupitza G, Mikulits W. van Zijl F, et al. Mutat Res. 2011 Jul-Oct;728(1-2):23-34. doi: 10.1016/j.mrrev.2011.05.002. Epub 2011 May 12. Mutat Res. 2011. PMID: 21605699 Free PMC article. Review. - Inhibition of breast cancer metastasis suppressor 1 promotes a mesenchymal phenotype in lung epithelial cells that express oncogenic K-RasV12 and loss of p53.
Hall EH, Liu Y, Xiao A, Shock L, Brautigan DL, Mayo MW, Adusumilli PS, Jones DR. Hall EH, et al. PLoS One. 2014 Apr 24;9(4):e95869. doi: 10.1371/journal.pone.0095869. eCollection 2014. PLoS One. 2014. PMID: 24763730 Free PMC article.
References
- Baldassarre G., Belletti B., Nicoloso M. S., Schiappacassi M., Vecchione A., Spessotto P., Morrione A., Canzonieri V., Colombatti A. p27(Kip1)-stathmin interaction influences sarcoma cell migration and invasion. Cancer Cell. 2005;7:51–63. - PubMed
- Belmont L. D., Mitchison T. J. Identification of a protein that interacts with tubulin dimers and increases the catastrophe rate of microtubules. Cell. 1996;84:623–631. - PubMed
- Curmi P. A., Gavet O., Charbaut E., Ozon S., Lachkar-Colmerauer S., Manceau V., Siavoshian S., Maucuer A., Sobel A. Stathmin and its phosphoprotein family: general properties, biochemical and functional interaction with tubulin. Cell Struct. Funct. 1999;24:345–357. - PubMed
Publication types
MeSH terms
Substances
LinkOut - more resources
Full Text Sources
Medical

