Arp2/3 complex interactions and actin network turnover in lamellipodia - PubMed (original) (raw)
Arp2/3 complex interactions and actin network turnover in lamellipodia
Frank P L Lai et al. EMBO J. 2008.
Abstract
Cell migration is initiated by lamellipodia-membrane-enclosed sheets of cytoplasm containing densely packed actin filament networks. Although the molecular details of network turnover remain obscure, recent work points towards key roles in filament nucleation for Arp2/3 complex and its activator WAVE complex. Here, we combine fluorescence recovery after photobleaching (FRAP) of different lamellipodial components with a new method of data analysis to shed light on the dynamics of actin assembly/disassembly. We show that Arp2/3 complex is incorporated into the network exclusively at the lamellipodium tip, like actin, at sites coincident with WAVE complex accumulation. Capping protein likewise showed a turnover similar to actin and Arp2/3 complex, but was confined to the tip. In contrast, cortactin-another prominent Arp2/3 complex regulator-and ADF/cofilin-previously implicated in driving both filament nucleation and disassembly-were rapidly exchanged throughout the lamellipodium. These results suggest that Arp2/3- and WAVE complex-driven actin filament nucleation at the lamellipodium tip is uncoupled from the activities of both cortactin and cofilin. Network turnover is additionally regulated by the spatially segregated activities of capping protein at the tip and cofilin throughout the mesh.
Figures
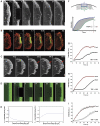
Figure 1
Actin assembly is restricted to the lamellipodium tip. (A) FRAP of EGFP–actin in lamellipodium of B16-F1 cell bleached as indicated by rectangle. Numbers in post-bleach images correspond to seconds. Bar: 3 μm. (B) Photoactivation of PA–EGFP–actin (green) within a lamellipodial region as indicated by rectangle in cell co-expressing mRFP–actin (red). Bar: 2 μm. (C) Rapid translocation to the leading edge of EGFP–actin bleached in the lamella (rectangle). Bleached actin incorporates at the leading edge and treadmills rearwards with the actin filament network (red arrows). Bar: 2 μm. (D) Monte Carlo diffusion model of the experiment shown in (A), with actin assembly/disassembly probability profiles shown in (E). Bar: 3 μm. (E) G-to-F (polymerization) and F-to-G (depolymerization) probability as a function of distance from the leading edge assumed for the simulation shown in (D). (F) Diagram explaining TMF calculation. Average intensities of front (F) and back (B) parts of the lamellipodium are plotted over time, and differential intensity per unit time calculated as shown. (G, H) Treadmilling analyses of the experiment shown in (A) and of its simulation shown in (D), respectively. (I) Treadmilling analysis for EGFP–actin as averaged from six independent movies. Data correspond to means and s.e.m. of front and back halves of analysed lamellipodia as indicated. Linear curves correspond to best fits of averaged data.
Figure 2
Arp2/3 complex dynamics as compared with WAVE and Abi. (A) FRAP of Arp2/3 complex (EGFP–ArpC5B) revealing its prominent incorporation at the lamellipodium tip. Time: seconds; bar: 2 μm. (B) Treadmilling analysis performed as depicted in Figure 1F for individual experiment shown in (A). (C) Results of EGFP–ArpC5B treadmilling analysis (means and s.e.m. from six independent movies) and best fits of averaged data as indicated. (D) Comparison of ArpC5B and actin analyses, with sizes of analysed lamellipodial areas set to the average lamellipodium width observed upon ArpC5B expression (n-actin designates actinnarrow, see also main text). Displayed are best fits of means (linear and dashed lines for actin and ArpC5B, respectively) of at least four movies for each component. (E) FRAP of the WAVE complex component Abi-1 at the lamellipodium tip. Bar: 2 μm. (F) Analysis of Abi-1 fluorescence recovery. Data are means and s.e.m. of five movies. Half-time of fluorescence recovery (_t_1/2) was calculated from best linear fit (green curve). (G) FRAP of EGFP–WAVE2. Bar: 2 μm. (H) Analysis of WAVE2 fluorescence recovery. Data are means and s.e.m. of seven movies. Half-time of fluorescence recovery (_t_1/2) was calculated from best linear fit (green curve).
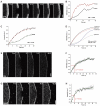
Figure 3
Turnover of cortactin and capping protein in the lamellipodium. (A) FRAP of EGFP–cortactin (construct 1) as indicated. Time: seconds; bar: 2 μm. (B) Treadmilling analysis of EGFP–cortactin. Plotted are averaged data (means and s.e.m. of means) and best linear fits of six independent movies. The comparably low TMF is due to homogenous fluorescence recovery in the entire lamellipodium. _t_1/2 given was calculated for entire lamellipodium. (C) FRAP of EGFP-tagged CP-beta2, the accumulation of which is largely confined to the lamellipodium front (see also Supplementary Figure 5). Bar: 2 μm. (D) Summary of FRAP analysis for CP-beta2. Data are means and s.e.m. (eight movies) as well as best linear fit (green) of averaged data. _t_1/2 of fluorescence recovery was calculated from best linear fit.
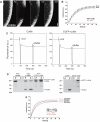
Figure 4
Characterization of cofilin turnover in B16-F1 cells. (A) FRAP of EGFP-tagged cofilin wild type as indicated. Time: seconds; bar: 2 μm. (B) Summary of treadmilling analysis for wild-type cofilin. Data are means and s.e.m. of five independent movies as well as linear fits of averaged data for front and back halves of the lamellipodium as indicated. Virtually no difference in fluorescence recovery between front and back lamellipodial halves was observed (TMF=0.061). _t_1/2 was calculated for entire lamellipodium. (C) Quenching of pyrenyl fluorescence by cofilin. Polymerized actin containing 10% pyrenyl-actin was diluted to 3 μM in a final volume of 1 ml, and after 100 s either 1 μM cofilin (left) or 1 μM EGFP–cofilin (right) were added (10 μl each) as indicated. After 200 s, 10 μl of 1 × actin polymerization buffer was added to the samples. The addition of both EGFP-tagged and untagged cofilin resulted in considerable quenching of pyrenyl fluorescence due to actin filament side binding, whereas buffer addition had no effect. (D) EGFP-tagged cofilin binds and depolymerizes actin filaments. (Left) 3 μM of polymerized actin was incubated with either 3 μM cofilin or 3 μM EGFP–cofilin for 2 h at 21°C. After high-speed sedimentation, proteins from pellets (P) and supernatants (S) were analysed by SDS–PAGE and Coomassie blue staining. Both cofilins are able to bind actin filaments as revealed by their appearance in the pellets (P), and their presence causes a considerable amount of actin to shift to the supernatant (S) fractions. Thus, in addition to binding, both cofilin variants promote actin filament disassembly in an indistinguishable manner. (Right) Neither cofilin variant is found in the pellet fraction in the absence of actin. (E) Best linear fits of averaged data from treadmilling analyses performed on FRAP movies acquired as shown in (A) of active (solid lines) and inactive (dashed lines) cofilin mutants as indicated (at least three movies for each mutant). Respective _t_1/2 values were calculated for the entire lamellipodium.
Figure 5
Actin and cofilin turnover in MTLn3 cells. FRAP of EGFP–actin (A) or EGFP–cofilin (B) in lamellipodia of MTLn3 cells shortly after EGF treatment (5 nM). Time: seconds; bars: 5 μm. Note exclusive recovery of actin but not cofilin from the front.
Figure 6
Schematic model summarizing the major results obtained in this study. (A) The lamellipodium is built by components, which fall into different categories. Here, we distinguish four of those categories, based on their localization pattern within the lamellipodial structure, their dynamics and/or function: tip components driving actin assembly from the barbed end (WAVE complex components or VASP); capping protein, also largely associating with the tip; components incorporating into and building the network (actin and Arp2/3 complex), clearly displaying treadmilling behaviour; and factors associating with the entire lamellipodium (cofilin and cortactin) without treadmilling. (B) Summary of the turnover rates measured for these lamellipodial regulators as indicated. Colour code is displayed on the right. Note that for components with biased recovery from the lamellipodium tip (actin and Arp2/3 complex), recovery times differ dependent on the distance from the distal tip. For cortactin, the gradual decrease in colour intensity indicates the decrease in fluorescence intensity from front to rear of the lamellipodium observed for this component, but not for cofilin. Cream-coloured boxes summarize turnover rates (expressed as half-times of recovery of fluorescence intensity) as measured for different components in different intra-lamellipodial regions. *Value measured for the cortactin–EGFP construct used in Figure 3.
Similar articles
- Arp2/3 complex is essential for actin network treadmilling as well as for targeting of capping protein and cofilin.
Koestler SA, Steffen A, Nemethova M, Winterhoff M, Luo N, Holleboom JM, Krupp J, Jacob S, Vinzenz M, Schur F, Schlüter K, Gunning PW, Winkler C, Schmeiser C, Faix J, Stradal TE, Small JV, Rottner K. Koestler SA, et al. Mol Biol Cell. 2013 Sep;24(18):2861-75. doi: 10.1091/mbc.E12-12-0857. Epub 2013 Jul 24. Mol Biol Cell. 2013. PMID: 23885122 Free PMC article. - Interactions with actin monomers, actin filaments, and Arp2/3 complex define the roles of WASP family proteins and cortactin in coordinately regulating branched actin networks.
Helgeson LA, Prendergast JG, Wagner AR, Rodnick-Smith M, Nolen BJ. Helgeson LA, et al. J Biol Chem. 2014 Oct 17;289(42):28856-69. doi: 10.1074/jbc.M114.587527. Epub 2014 Aug 26. J Biol Chem. 2014. PMID: 25160634 Free PMC article. - Model of turnover kinetics in the lamellipodium: implications of slow- and fast- diffusing capping protein and Arp2/3 complex.
McMillen LM, Vavylonis D. McMillen LM, et al. Phys Biol. 2016 Dec 6;13(6):066009. doi: 10.1088/1478-3975/13/6/066009. Phys Biol. 2016. PMID: 27922825 Free PMC article. - Steering cell migration: lamellipodium dynamics and the regulation of directional persistence.
Krause M, Gautreau A. Krause M, et al. Nat Rev Mol Cell Biol. 2014 Sep;15(9):577-90. doi: 10.1038/nrm3861. Nat Rev Mol Cell Biol. 2014. PMID: 25145849 Review. - From WRC to Arp2/3: Collective molecular mechanisms of branched actin network assembly.
Bieling P, Rottner K. Bieling P, et al. Curr Opin Cell Biol. 2023 Feb;80:102156. doi: 10.1016/j.ceb.2023.102156. Epub 2023 Mar 1. Curr Opin Cell Biol. 2023. PMID: 36868090 Review.
Cited by
- Control of polarized assembly of actin filaments in cell motility.
Carlier MF, Pernier J, Montaville P, Shekhar S, Kühn S; Cytoskeleton Dynamics and Motility group. Carlier MF, et al. Cell Mol Life Sci. 2015 Aug;72(16):3051-67. doi: 10.1007/s00018-015-1914-2. Epub 2015 May 7. Cell Mol Life Sci. 2015. PMID: 25948416 Free PMC article. Review. - Forces generated by lamellipodial actin filament elongation regulate the WAVE complex during cell migration.
Mehidi A, Kage F, Karatas Z, Cercy M, Schaks M, Polesskaya A, Sainlos M, Gautreau AM, Rossier O, Rottner K, Giannone G. Mehidi A, et al. Nat Cell Biol. 2021 Nov;23(11):1148-1162. doi: 10.1038/s41556-021-00786-8. Epub 2021 Nov 4. Nat Cell Biol. 2021. PMID: 34737443 - Mechanisms of leading edge protrusion in interstitial migration.
Wilson K, Lewalle A, Fritzsche M, Thorogate R, Duke T, Charras G. Wilson K, et al. Nat Commun. 2013;4:2896. doi: 10.1038/ncomms3896. Nat Commun. 2013. PMID: 24305616 Free PMC article. - New single-molecule speckle microscopy reveals modification of the retrograde actin flow by focal adhesions at nanometer scales.
Yamashiro S, Mizuno H, Smith MB, Ryan GL, Kiuchi T, Vavylonis D, Watanabe N. Yamashiro S, et al. Mol Biol Cell. 2014 Apr;25(7):1010-24. doi: 10.1091/mbc.E13-03-0162. Epub 2014 Feb 5. Mol Biol Cell. 2014. PMID: 24501425 Free PMC article. - Adaptor protein LRAP25 mediates myotonic dystrophy kinase-related Cdc42-binding kinase (MRCK) regulation of LIMK1 protein in lamellipodial F-actin dynamics.
Lee ICJ, Leung T, Tan I. Lee ICJ, et al. J Biol Chem. 2014 Sep 26;289(39):26989-27003. doi: 10.1074/jbc.M114.588079. Epub 2014 Aug 8. J Biol Chem. 2014. PMID: 25107909 Free PMC article.
References
- Andrianantoandro E, Pollard TD (2006) Mechanism of actin filament turnover by severing and nucleation at different concentrations of ADF/cofilin. Mol Cell 24: 13–23 - PubMed
- Carlier MF, Pantaloni D (2007) Control of actin assembly dynamics in cell motility. J Biol Chem 282: 23005–23009 - PubMed
- Carlier MF, Ressad F, Pantaloni D (1999) Control of actin dynamics in cell motility. Role of ADF/cofilin. J Biol Chem 274: 33827–33830 - PubMed
Publication types
MeSH terms
Substances
LinkOut - more resources
Full Text Sources
Other Literature Sources
Molecular Biology Databases
Research Materials
Miscellaneous


