Mitochondrial fusion and function in Charcot-Marie-Tooth type 2A patient fibroblasts with mitofusin 2 mutations - PubMed (original) (raw)
Mitochondrial fusion and function in Charcot-Marie-Tooth type 2A patient fibroblasts with mitofusin 2 mutations
Elizabeth A Amiott et al. Exp Neurol. 2008 May.
Abstract
Charcot-Marie-Tooth Type 2A is a dominantly inherited peripheral neuropathy characterized by axonal degeneration of sensory and motor nerves. The disease is caused by mutations in the mitochondrial fusion gene MFN2. Mfn2 is an integral outer mitochondrial membrane protein composed of a large GTPase domain and two heptad repeat (HR) domains that face the cytoplasm. Mitochondrial membrane fusion and division are balanced processes that are necessary to maintain tubular mitochondrial morphology, respiratory function, and uniform distribution of the organelle throughout the cell. We have utilized primary fibroblasts from CMT2A patients to survey mitochondrial phenotypes associated with heterozygous MFN2 alleles expressed at physiological levels. Our results indicate that, in fibroblasts, mitofusin expression, mitochondrial morphology, ultrastructure, mtDNA content, and respiratory capacity are not affected by the presence of mutant Mfn2 protein. Consistent with a lack of mitochondrial dysfunction, we also show that mitochondrial fusion occurs efficiently in CMT2A patient-derived fibroblasts. Our observations are in agreement with the neuronal specificity of the disease and are consistent with a recent finding that mitochondrial fusion can be maintained in cells that express mutant Mfn2 protein due to complementation by a second mitofusin, Mfn1. We discuss our results and those of others in terms of a comprehensive model for the mechanism(s) by which mutations in MFN2 may lead to CMT2A disease.
Figures
Figure 1. Mfn2 domain structure and location of CMT2A mutations
A schematic of the predicted functional and structural domains of Mfn2. The location of each CMT2A-associated amino acid substitution analyzed in this study is indicated. G1–G4 = functional motifs within the GTPase domain, TM = transmembrane domain, HR = heptad repeat or putative coil-coil domain.
Figure 2. Western analysis of mitofusin abundance and Mfn2 localization
(A) Western blot analysis of the mitochondrial proteins Mfn2, porin, and Mfn1 (~86 kDa, 31 kDa, and 84 kDa, respectively) in 10μg protein from whole cell extracts of Control and CMT2A patient-derived fibroblasts. Mfn2 signal was normalized to porin and the ratio for the Control was set equal to 1.0. Bars represent average Mfn2 levels relative to porin and error bars indicate the standard deviation from triplicate analyses. (B) Western blot analysis of Mfn2, porin, and GAPDH (~37 kDa) in mitochondrial pellets (Mito) and post-mitochondrial supernatants (PMS) from Control and Mfn2-mutant CMT2A fibroblasts. The outer mitochondrial membrane proteins Mfn2 and porin are detected primarily in the mitochondrial fractions while cytoplasmic GAPDH is only in PMS fractions. Mfn2 levels appear consistent between samples and both WT and mutant proteins are properly targeted and localized to the mitochondrial fraction.
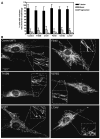
Figure 3. Mitochondrial morphology in Control and CMT2A patient-derived fibroblasts
Primary fibroblast cultures were stained with 15nM MitoTracker for 6–8 hours and visualized by fluorescence microscopy. (A) Quantification of the percent of each population exhibiting the indicated mitochondrial morphologies. Tubular = interconnected tubular mitochondrial structures forming a network distributed throughout the cell. Mixed = a combination of normal tubular structures intermixed with spherical mitochondrial fragments. Fragmented = completely fragmented or spherical mitochondria. At least 100 individual cells per population were scored per experiment. Bars represent the mean percentage per category and error bars indicate the standard deviation from triplicate experiments. (B) Representative images of MitoTracker stained mitochondria in Control and CMT2A fibroblasts with the indicated Mfn2 amino acid substitutions. Insets are zoomed to highlight distinct tubular structures in the boxed areas.
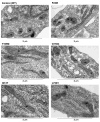
Figure 4. Mitochondrial ultrastructure in Control and CMT2A patient-derived fibroblasts
Primary fibroblast cultures were fixed and processed for transmission electron microscopy as described in Materials and Methods. Representative electron micrographs show normal gross mitochondrial morphology, quantity, and distribution in Control and the indicated Mfn2 mutant cells. Mitochondria are marked (m) and appear spherical or as longer tubules depending on the sectioning. A visible double membrane surrounds most of the pictured mitochondria and several have visible inner membrane cristae in the plane of focus, confirming normal mitochondrial ultrastructure.
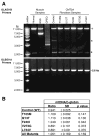
Figure 5. PCR-based mitochondrial DNA analysis
(A) Agarose gels displaying PCR products from muscle and fibroblast DNA samples using primers OLA/D1B and OLB/D1A. An 11kb PCR product generated from OLA/D1B primers is clearly visible in ‘Normal’ muscle and all fibroblast samples. Amplification of DNA isolated from muscle of a KSS patient produced a full-length product of 11kb as well as a deletion product of ~6kb. Amplification of DNA from muscle of a CPEO patient generated a large smear of DNA, indicating multiple deletions of the genome. All products generated from primers OLB/D1A are ~5.6 kb, the expected size for intact mtDNA. Asterisks (*) indicate non-specific amplification products visible in all lanes upon longer exposure. Analysis of DNA isolated from P5 fibroblasts produced results that were identical to those shown here for P11 cells. (B) Results of qRT-PCR analysis of mtDNA in Control and CMT2A fibroblasts. The ratio of mtDNA/β-globin (± standard deviation) was calculated from triplicate experiments to determine the amount of mtDNA relative to a single copy nuclear gene (β-globin) in each sample. The Student’s t-test (unpaired, two-sample equal variance) was applied to the Control (WT) and each MFN2 mutant sample as well as all the mutant samples pooled together (All Mutants). A p value ≤ 0.05 indicates statistical significance.
Figure 6. Respiration rates in control and CMT2A patient-derived fibroblasts
(A) Comparison of oxygen consumption rates for Control and mutant MFN2 (T105M, I213T, and V273G) fibroblast cultures measured under basal and uncoupled conditions. Bars represent the mean respiration rate (nmoles O2/min/mL) and error bars indicate the standard deviation from four independent measurements. Listed below each set of bars is the fold increase in respiration observed upon uncoupling by DNP addition (ratio of uncoupled/basal) ± standard deviation. (B) Vertical scatter plot indicating the range of basal respiration rates observed from multiple measures for each fibroblast population. (C) Vertical scatter plot indicating the range of uncoupled respiration rates observed from multiple measures for each fibroblast population. Each circle indicates an individual data point and the horizontal bar represents the mean value from replicate measures.
Figure 7. Mitochondrial fusion in cell hybrids formed from Control or CMT2A patient-derived fibroblasts
PEG fusion of Control (A) and I213T mutant (B) fibroblasts expressing mito-GFP and mito-RFP. Cell hybrids contain two or more nuclei visualized with DAPI (blue) and overlapping red and green fluorescence (yellow) indicates successful mitochondrial fusion. The Control cell hybrid in (A) has normal tubular mitochondrial morphology with extensive mitochondrial fusion. The cell hybrid of I213T mutant cells in (B) displays mixed mitochondrial morphology (tubular and spherical mitochondria) with fused tubular mitochondria and some fused spherical mitochondria. (A′) and (B′) are zoomed images of the boxed regions in the ‘Merged’ panels of (A) and (B), respectively. Asterisks (*) indicate unfused mito-GFP spherical mitochondria, carats (^) indicate unfused mito-RFP spherical mitochondria, and arrows (↑) point to fused spherical mitochondria.
Similar articles
- Mitochondrial Dysfunction and Pharmacodynamics of Mitofusin Activation in Murine Charcot-Marie-Tooth Disease Type 2A.
Franco A, Dang X, Zhang L, Molinoff PB, Dorn GW 2nd. Franco A, et al. J Pharmacol Exp Ther. 2022 Nov;383(2):137-148. doi: 10.1124/jpet.122.001332. Epub 2022 Sep 2. J Pharmacol Exp Ther. 2022. PMID: 36507849 Free PMC article. - Mitofusin 2 mutations affect mitochondrial function by mitochondrial DNA depletion.
Vielhaber S, Debska-Vielhaber G, Peeva V, Schoeler S, Kudin AP, Minin I, Schreiber S, Dengler R, Kollewe K, Zuschratter W, Kornblum C, Zsurka G, Kunz WS. Vielhaber S, et al. Acta Neuropathol. 2013 Feb;125(2):245-56. doi: 10.1007/s00401-012-1036-y. Epub 2012 Aug 28. Acta Neuropathol. 2013. PMID: 22926664 - Altered axonal mitochondrial transport in the pathogenesis of Charcot-Marie-Tooth disease from mitofusin 2 mutations.
Baloh RH, Schmidt RE, Pestronk A, Milbrandt J. Baloh RH, et al. J Neurosci. 2007 Jan 10;27(2):422-30. doi: 10.1523/JNEUROSCI.4798-06.2007. J Neurosci. 2007. PMID: 17215403 Free PMC article. - Role of mitofusin 2 mutations in the physiopathology of Charcot-Marie-Tooth disease type 2A.
Cartoni R, Martinou JC. Cartoni R, et al. Exp Neurol. 2009 Aug;218(2):268-73. doi: 10.1016/j.expneurol.2009.05.003. Epub 2009 May 8. Exp Neurol. 2009. PMID: 19427854 Review. - MFN2-related neuropathies: Clinical features, molecular pathogenesis and therapeutic perspectives.
Stuppia G, Rizzo F, Riboldi G, Del Bo R, Nizzardo M, Simone C, Comi GP, Bresolin N, Corti S. Stuppia G, et al. J Neurol Sci. 2015 Sep 15;356(1-2):7-18. doi: 10.1016/j.jns.2015.05.033. Epub 2015 May 29. J Neurol Sci. 2015. PMID: 26143526 Review.
Cited by
- Tourette Syndrome Risk Genes Regulate Mitochondrial Dynamics, Structure, and Function.
Clarke RA, Furlong TM, Eapen V. Clarke RA, et al. Front Psychiatry. 2021 Mar 10;11:556803. doi: 10.3389/fpsyt.2020.556803. eCollection 2020. Front Psychiatry. 2021. PMID: 33776808 Free PMC article. - Study of RNA Interference Targeting NET-1 Combination with Sorafenib for Hepatocellular Carcinoma Therapy In Vitro and In Vivo.
He S, Wei YZ, Wang GL, Xu YY, Zhou JM, Zhang YX, Chen L. He S, et al. Gastroenterol Res Pract. 2013;2013:685150. doi: 10.1155/2013/685150. Epub 2013 Nov 7. Gastroenterol Res Pract. 2013. PMID: 24307893 Free PMC article. - Structure, function, and regulation of mitofusin-2 in health and disease.
Chandhok G, Lazarou M, Neumann B. Chandhok G, et al. Biol Rev Camb Philos Soc. 2018 May;93(2):933-949. doi: 10.1111/brv.12378. Epub 2017 Oct 25. Biol Rev Camb Philos Soc. 2018. PMID: 29068134 Free PMC article. Review. - Combined RNA interference and gene replacement therapy targeting MFN2 as proof of principle for the treatment of Charcot-Marie-Tooth type 2A.
Rizzo F, Bono S, Ruepp MD, Salani S, Ottoboni L, Abati E, Melzi V, Cordiglieri C, Pagliarani S, De Gioia R, Anastasia A, Taiana M, Garbellini M, Lodato S, Kunderfranco P, Cazzato D, Cartelli D, Lonati C, Bresolin N, Comi G, Nizzardo M, Corti S. Rizzo F, et al. Cell Mol Life Sci. 2023 Nov 25;80(12):373. doi: 10.1007/s00018-023-05018-w. Cell Mol Life Sci. 2023. PMID: 38007410 Free PMC article. - Adenine nucleotide translocase is involved in a mitochondrial coupling defect in MFN2-related Charcot-Marie-Tooth type 2A disease.
Guillet V, Gueguen N, Verny C, Ferre M, Homedan C, Loiseau D, Procaccio V, Amati-Bonneau P, Bonneau D, Reynier P, Chevrollier A. Guillet V, et al. Neurogenetics. 2010 Feb;11(1):127-33. doi: 10.1007/s10048-009-0207-z. Epub 2009 Jul 18. Neurogenetics. 2010. PMID: 19618221
References
- Baloh RH. Mitochondrial Dynamics and Peripheral Neuropathy. Neuroscientist 2007
- Baxter RV, Ben Othmane K, Rochelle JM, Stajich JE, Hulette C, Dew-Knight S, Hentati F, Ben Hamida M, Bel S, Stenger JE, Gilbert JR, Pericak-Vance MA, Vance JM. Ganglioside-induced differentiation-associated protein-1 is mutant in Charcot-Marie-Tooth disease type 4A/8q21. Nat Genet. 2002;30:21–22. - PubMed
- Chan DC. Mitochondria: dynamic organelles in disease, aging, and development. Cell. 2006a;125:1241–1252. - PubMed
Publication types
MeSH terms
Substances
Grants and funding
- SK23 NS 42713-05/NS/NINDS NIH HHS/United States
- K23 NS042713/NS/NINDS NIH HHS/United States
- R01 GM053466/GM/NIGMS NIH HHS/United States
- S10 RR023454/RR/NCRR NIH HHS/United States
- K08 NS 48180/NS/NINDS NIH HHS/United States
- GM 53466/GM/NIGMS NIH HHS/United States
- T32 HD 07576-22/HD/NICHD NIH HHS/United States
- M01 RR000064/RR/NCRR NIH HHS/United States
- S10 RR019409/RR/NCRR NIH HHS/United States
- 1S10 RR 023454/RR/NCRR NIH HHS/United States
- K08 NS048180/NS/NINDS NIH HHS/United States
- S10 RR022588/RR/NCRR NIH HHS/United States
- M01 RR 00064/RR/NCRR NIH HHS/United States
- S10 RR021023/RR/NCRR NIH HHS/United States
- T32 HL007576/HL/NHLBI NIH HHS/United States
LinkOut - more resources
Full Text Sources
Other Literature Sources
Medical


