Timing neurogenesis and differentiation: insights from quantitative clonal analyses of cerebellar granule cells - PubMed (original) (raw)
Comparative Study
Timing neurogenesis and differentiation: insights from quantitative clonal analyses of cerebellar granule cells
J Sebastian Espinosa et al. J Neurosci. 2008.
Abstract
The cerebellum is an excellent model system to study how developmental programs give rise to exquisite neuronal circuits in the adult brain. Here, we describe our findings regarding granule cell neurogenesis and differentiation using the MADM method (mosaic analysis with double markers) in mice. By following the development of individual granule cell clones, we show that (1) granule cell precursors (GCPs) undergo predominantly symmetric division during postnatal development; (2) clonally related granule cells (GCs) exit the cell cycle within a narrow time window and stack their axons in the molecular layer in chronological order from deep to superficial sublayers; and (3) whereas the average GCP proliferation in the external granular layer is progressively slower as development proceeds, there is a rapid expansion of GCPs shortly before clonally related GCs exit the cell cycle. These properties produce GC clones that are distinct, each having a restricted axonal projection, but that are on average similar in cell number. We discuss possible developmental mechanisms and functional implications of these findings.
Figures
Figure 1.
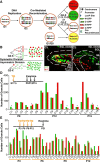
GCPs divide predominantly symmetrically during perinatal and postnatal development. A, Schematic of the MADM method illustrating Cre-mediated interchromosomal recombination that results in reconstitution of two fluorescent markers, GFP and red fluorescent protein (dsRed2-Myc). If recombination occurs in G2 phase, chromatids can segregate to generate two differentially labeled cells (G2-X segregation), or one doubly labeled cell and one unlabeled cell (G2-Z segregation). Recombination in G1 or G0 generates a doubly labeled cell. B, MADM G2-X labeling can distinguish between two modes of division: symmetric and asymmetric. Completely symmetric divisions should generate same numbers of differentially labeled cells, whereas completely asymmetric divisions should generate a single cell labeled with one marker and all other cells labeled with the other marker. Open circles, GCPs; filled circles, postmitotic GCs. C, Two exemplary confocal images of MADM G2-X labeling of GCs. Tamoxifen (TM) was applied intraperitoneally at E17.5 in the pregnant mother. Progeny of the genotype _GR/RG;_β-Actin-CreER were examined. C 1, A clone of dividing GCPs restricted to the EGL. C 2, A clone of differentiated GCs restricted to the IGL. Dashed white lines trace the borders between layers based on DAPI staining not shown. D, Inset, Schematic of the experiment (TM application at E17.5; dissection time points at P9–P15). The bar graph shows paired counts for green and red cells in each clone analyzed. The asterisk represents EGL clones, which are markedly smaller than IGL clones (the rest) that have completed cell division (see Fig. 4). We exclude G2-X clones <25 cells because a lower total number has less power, although small clones also followed this trend with a similar number of red and green cells. E, Inset, Schematic of the experiment (TM application at P3–P12; dissection at P21). The bar graph shows paired counts for green and red cells in each GC clone analyzed.
Figure 2.
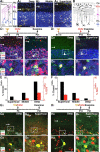
GCs stack their axons in the ML in a temporal sequence from deep to superficial sublayers. A, To induce MADM G2-X, G2-Z, or G1 labeling, tamoxifen was applied intraperitoneally at E17.5 in the pregnant mother. Progeny of the genotype GR/RG;β-Actin-CreER were examined. A 1, A schematic of cerebellar layers in the adult mouse. PCL, Purkinje cell layer; WM, white matter. A2–A 4, Exemplary confocal images of MADM G1 or G2-Z labeling of clones analyzed at P21, a time point when GCs have completed migration and exhibit mature morphology. All clonally related GCs project axons to the same restricted sublayer in the ML. For quantitative analysis in this and subsequent figures, we compartmentalize GC clones into one of three classes based on their average axonal projection pattern: deep (lower one-third), middle (middle one-third), superficial (top one-third). B, A schematic drawing by Ramon y Cajal (1911) depicts previous observations via Golgi staining, suggesting that GCs may stack their axons in accordance to their birth timing. C 1, A schematic of the experiment: tamoxifen application at E17.5, followed by a pulse injection of CldU at P6, and examination at P21. C 2, C 4, Exemplary confocal images of deep and superficial projecting GC clones, respectively. C 3, C 5, Magnified images of boxes in C 2 and C 4 demonstrating colabeling of GFP and CldU. D, Same as C, except that CldU was applied at P15. E, Percentage of IGL clones that have one or more cells labeled with CldU (ClonesCldU+) shown in black and percentage of GCs in a given IGL clone that have CldU labeling (GCsCldU+) shown in red for different types of IGL clones. Quantifications correspond to the timeline depicted in C 1. F, Same as E, except quantifications correspond to the timeline depicted in D 1. G 1, A schematic of the experiment: coinjection of tamoxifen and CldU at P6 and examination at P21. G 2, G 4, Singly labeled CldU+/GFP+ GCs and their corresponding projection to the ML, deep and superficial, respectively. G 3, G 5, Magnified images of boxes in G 2 and G 4 demonstrating colabeling of GFP and CldU. H, Same as G, except that CldU was applied at P15.
Figure 3.
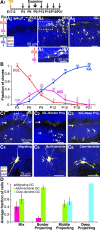
Orderly differentiation of GC clones during postnatal development. A 1, A schematic of the experiment: tamoxifen application at E17.5, and dissection time points from P3 to P21. A2–A 4, Confocal images illustrating three main classes of clones found at P9: EGL, MIX, and IGL. IGL clones always have axonal projections (A 4, arrow) in the ML positioned below the EGL/ML border (A 4, arrowhead). A 5, Magnified image of the box in A 3 depicting formation of GC axons (arrow) at the EGL/ML border and parallel to the pia typical of all MIX clones. B, Frequency distribution of the three different types of clones illustrated in A2–A 4 for different postnatal time points. C1–C 3, Confocal images illustrating three classes of clones observed at P12 undergoing maturation of dendritic processes. Cells of a MIX clone have the least mature dendritic morphology, and IGL clones projecting to progressively deeper sublayers in the ML have progressively more mature dendritic morphology. C4–C 6, Confocal images of three types of postmitotic GCs undergoing maturation of processes from migrating leading processes, to multiple dendrites, to claw-like dendrites. Colored symbols in C4–C 6 correspond to GC types found in C1–C 3. D, Frequency of dendritic maturation among GCs exemplified in C4–C 6 for different classes of granule clones exemplified in C1–C 3. Colored bars correspond to colored arrowheads and borders in C.
Figure 4.
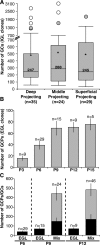
Cell number matching among GC clones with distinct axonal projection patterns. A, Box plot representative of IGL clones grouped by the corresponding axonal projection pattern. The box demarcates the lower quartile, median (number), mean (asterisk), and upper quartile. Whiskers represent the lowest and highest values that are not outliers [<1.5 × interquartile range (IQR)]. Mild outliers are represented by a filled dot (>1.5*IQR and <3*IQR), and extreme outliers are represented by an open dot (>3*IQR). B, Average number of GCPs per EGL clone quantified at different postnatal time points. C, Average number of GCPs per EGL clone compared with the average number of GCPs/GCs per MIX clone at P9. Light gray bars illustrate average numbers of cells in MIX clones. Black bars illustrate average numbers of cells in the EGL region of MIX clones (representing GCPs).
Figure 5.
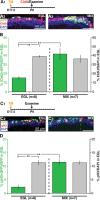
Clonally related GCPs divide faster shortly before differentiation. A 1, A schematic of the experiment: tamoxifen application at E17.5, followed by a pulse injection of CldU at P9 to label the S phase. Mice were killed 2 h after CldU injection, and clonally related GCs were examined for colabeling with CldU and their axonal projection pattern. A 2, A 3, Representative confocal images of a P9 MADM-labeled EGL clone and a MIX clone, respectively. B, Quantification of the average representation of CldU-labeled cells within individual MADM clones (green bars), or among the surrounding DAPI-labeled cells within the EGL (gray bars). EGL MADM clones are significantly different from the surrounding EGL region and MIX MADM clones (**p < 0.001). C 1, A schematic of the experiment: tamoxifen application at E17.5, followed by examination of clonally related progeny at P9 costained with pH3 to label cells in the M phase. C 2, C 3, Representative confocal images of a P9 MADM-labeled EGL clone and a MIX clone, respectively. D, Same as B, except pH3 was used instead of CldU.
Figure 6.
Schematic summary of neurogenesis and differentiation of clonally related GCs. We use two MADM clones induced at E17.5 to illustrate the main findings of this study: (1) the result of a G1 or G2-Z recombination event, subsequently represented by yellow cells; (2) the result of a G2-X event, subsequently represented by green and red cells. GCPs undergo predominantly symmetric division during postnatal development (exemplified by same numbers of green and red cells). GCPs expansion decreases in the external granular layer (EGL) but speeds up division shortly before differentiation onset. At a specific temporal window, clonally related GCs exit the cell cycle and stack their axons in the molecular layer (ML) during differentiation. Early differentiating cells (yellow) stack their axons to deep sublayers in the ML, whereas cells that differentiate late (red and green) stack their axons to more superficial sublayers. This series of events produces GC clones that are distinct, each having a restricted axonal projection pattern, but that on average are similar in cell number. PCL, Purkinje cell layer; IGL, internal granular layer; WM, white matter.
Similar articles
- Cerebellar granule cells are predominantly generated by terminal symmetric divisions of granule cell precursors.
Nakashima K, Umeshima H, Kengaku M. Nakashima K, et al. Dev Dyn. 2015 Jun;244(6):748-58. doi: 10.1002/dvdy.24276. Epub 2015 Apr 23. Dev Dyn. 2015. PMID: 25820187 - Meis1 Coordinates Cerebellar Granule Cell Development by Regulating Pax6 Transcription, BMP Signaling and Atoh1 Degradation.
Owa T, Taya S, Miyashita S, Yamashita M, Adachi T, Yamada K, Yokoyama M, Aida S, Nishioka T, Inoue YU, Goitsuka R, Nakamura T, Inoue T, Kaibuchi K, Hoshino M. Owa T, et al. J Neurosci. 2018 Jan 31;38(5):1277-1294. doi: 10.1523/JNEUROSCI.1545-17.2017. Epub 2018 Jan 9. J Neurosci. 2018. PMID: 29317485 Free PMC article. - Progressive restriction of cell fates in relation to neuroepithelial cell mingling in the mouse cerebellum.
Mathis L, Nicolas JF. Mathis L, et al. Dev Biol. 2003 Jun 1;258(1):20-31. doi: 10.1016/s0012-1606(03)00098-8. Dev Biol. 2003. PMID: 12781679 - Origins, Development, and Compartmentation of the Granule Cells of the Cerebellum.
Consalez GG, Goldowitz D, Casoni F, Hawkes R. Consalez GG, et al. Front Neural Circuits. 2021 Jan 15;14:611841. doi: 10.3389/fncir.2020.611841. eCollection 2020. Front Neural Circuits. 2021. PMID: 33519389 Free PMC article. Review. - Caught in the matrix: how vitronectin controls neuronal differentiation.
Wechsler-Reya RJ. Wechsler-Reya RJ. Trends Neurosci. 2001 Dec;24(12):680-2. doi: 10.1016/s0166-2236(00)02058-0. Trends Neurosci. 2001. PMID: 11718852 Review.
Cited by
- Projection-dependent heterogeneity of cerebellar granule cell calcium responses.
Rhee JK, Park H, Kim T, Yamamoto Y, Tanaka-Yamamoto K. Rhee JK, et al. Mol Brain. 2021 Mar 31;14(1):63. doi: 10.1186/s13041-021-00773-y. Mol Brain. 2021. PMID: 33789707 Free PMC article. - Clonal analysis reveals granule cell behaviors and compartmentalization that determine the folded morphology of the cerebellum.
Legué E, Riedel E, Joyner AL. Legué E, et al. Development. 2015 May 1;142(9):1661-71. doi: 10.1242/dev.120287. Epub 2015 Apr 1. Development. 2015. PMID: 25834018 Free PMC article. - Advances in light microscopy for neuroscience.
Wilt BA, Burns LD, Wei Ho ET, Ghosh KK, Mukamel EA, Schnitzer MJ. Wilt BA, et al. Annu Rev Neurosci. 2009;32:435-506. doi: 10.1146/annurev.neuro.051508.135540. Annu Rev Neurosci. 2009. PMID: 19555292 Free PMC article. Review. - Development and cancer of the cerebellum.
Hatten ME, Roussel MF. Hatten ME, et al. Trends Neurosci. 2011 Mar;34(3):134-42. doi: 10.1016/j.tins.2011.01.002. Trends Neurosci. 2011. PMID: 21315459 Free PMC article. Review. - Mitotic events in cerebellar granule progenitor cells that expand cerebellar surface area are critical for normal cerebellar cortical lamination in mice.
Chang JC, Leung M, Gokozan HN, Gygli PE, Catacutan FP, Czeisler C, Otero JJ. Chang JC, et al. J Neuropathol Exp Neurol. 2015 Mar;74(3):261-72. doi: 10.1097/NEN.0000000000000171. J Neuropathol Exp Neurol. 2015. PMID: 25668568 Free PMC article.
References
- Adams NC, Tomoda T, Cooper M, Dietz G, Hatten ME. Mice that lack astrotactin have slowed neuronal migration. Development. 2002;129:965–972. - PubMed
- Alder J, Cho NK, Hatten ME. Embryonic precursor cells from the rhombic lip are specified to a cerebellar granule neuron identity. Neuron. 1996;17:389–399. - PubMed
- Altman J, Bayer SA. Boca Raton, FL: CRC; 1997. Development of the cerebellar system in relation to its evolution, structure and function.
- Ashwell KW, Zhang LL. Ontogeny of afferents to the fetal rat cerebellum. Acta Anat (Basel) 1992;145:17–23. - PubMed
- Barres BA, Lazar MA, Raff MC. A novel role for thyroid hormone, glucocorticoids and retinoic acid in timing oligodendrocyte development. Development. 1994;120:1097–1108. - PubMed
Publication types
MeSH terms
Grants and funding
- F31 NS053270/NS/NINDS NIH HHS/United States
- R01 NS050835/NS/NINDS NIH HHS/United States
- HHMI/Howard Hughes Medical Institute/United States
- R01-NS050835/NS/NINDS NIH HHS/United States
LinkOut - more resources
Full Text Sources
Miscellaneous
