Hue-shifted monomeric variants of Clavularia cyan fluorescent protein: identification of the molecular determinants of color and applications in fluorescence imaging - PubMed (original) (raw)
Hue-shifted monomeric variants of Clavularia cyan fluorescent protein: identification of the molecular determinants of color and applications in fluorescence imaging
Hui-wang Ai et al. BMC Biol. 2008.
Abstract
Background: In the 15 years that have passed since the cloning of Aequorea victoria green fluorescent protein (avGFP), the expanding set of fluorescent protein (FP) variants has become entrenched as an indispensable toolkit for cell biology research. One of the latest additions to the toolkit is monomeric teal FP (mTFP1), a bright and photostable FP derived from Clavularia cyan FP. To gain insight into the molecular basis for the blue-shifted fluorescence emission we undertook a mutagenesis-based study of residues in the immediate environment of the chromophore. We also employed site-directed and random mutagenesis in combination with library screening to create new hues of mTFP1-derived variants with wavelength-shifted excitation and emission spectra.
Results: Our results demonstrate that the protein-chromophore interactions responsible for blue-shifting the absorbance and emission maxima of mTFP1 operate independently of the chromophore structure. This conclusion is supported by the observation that the Tyr67Trp and Tyr67His mutants of mTFP1 retain a blue-shifted fluorescence emission relative to their avGFP counterparts (that is, Tyr66Trp and Tyr66His). Based on previous work with close homologs, His197 and His163 are likely to be the residues with the greatest contribution towards blue-shifting the fluorescence emission. Indeed we have identified the substitutions His163Met and Thr73Ala that abolish or disrupt the interactions of these residues with the chromophore. The mTFP1-Thr73Ala/His163Met double mutant has an emission peak that is 23 nm red-shifted from that of mTFP1 itself. Directed evolution of this double mutant resulted in the development of mWasabi, a new green fluorescing protein that offers certain advantages over enhanced avGFP (EGFP). To assess the usefulness of mTFP1 and mWasabi in live cell imaging applications, we constructed and imaged more than 20 different fusion proteins.
Conclusion: Based on the results of our mutagenesis study, we conclude that the two histidine residues in close proximity to the chromophore are approximately equal determinants of the blue-shifted fluorescence emission of mTFP1. With respect to live cell imaging applications, the mTFP1-derived mWasabi should be particularly useful in two-color imaging in conjunction with a Sapphire-type variant or as a fluorescence resonance energy transfer acceptor with a blue FP donor. In all fusions attempted, both mTFP1 and mWasabi give patterns of fluorescent localization indistinguishable from that of well-established avGFP variants.
Figures
Figure 1
Chromophore structures of mTFP1 and its hue-shifted variants. (A) The chromophore structure shared by EGFP, mTFP1 and mWasabi. (B) The chromophore structure shared by ECFP and the mTFP1-Y67W variant. (C) The chromophore structure shared by EBFP and the mTFP1-Y67H variant.
Figure 2
The chromophore environment of mTFP1, amFP486 and avGFP-S65T. (A) The chromophore of mTFP1 (Protein data bank (PDB) code 2HQK) in space filling representation [19]. The side chains of residues that are discussed in the text and that are in close proximity to the chromophore are shown in ball-and-stick. Hydrogen bonds are indicated with black dotted lines. Cα for each residue is represented as a black sphere. Atoms labeled 'W' are ordered water molecules. (B) The chromophore environment of amFP486 showing the residues that are structurally aligned with the residues represented in (A) (PDB code 2A46) [20]. (C) The chromophore environment of avGFP-S65T (and EGFP) showing the residues that structurally align with those represented in (A) (PDB code 1EMA) [26]. avGFP-S65T and EGFP differ only by the Phe64Leu mutation which does not significantly modify the conformation of any residues shown in this figure.
Figure 3
Spectra of hue-shifted variants of mTFP1. (A) Excitation (open symbols) and emission (filled symbols) spectra of EGFP (circle) and mTFP1 (square). (B) Excitation (open symbols) and emission (filled symbols) spectra of ECFP (circle) and mTFP1-Y67W (square). (C) Excitation (open symbols) and emission (filled symbols) spectra of EBFP (circle) and the absorbance (open symbols) spectrum of the nonfluorescent mTFP1-Y67H variant (square). (D) Excitation (open symbols) and emission (filled symbols) spectra of mWasabi (circle), EGFP (square) and Emerald (triangle). Spectra were collected at 1 nm steps, but only every fifth data point is shown for clarity.
Figure 4
Two-color imaging with Sapphire/EGFP. Shown in the upper row of panels are HeLa cells that have been transfected with plasmids for expression of both Sapphire-actin and EGFP-NLS. Shown in the lower row of panels are identically treated HeLa cells expressing Sapphire-actin and mWasabi-NLS. Owing to the residual excitation of EGFP at 400 nm, the nucleus fluoresces brightly in the Sapphire emission channel in the top row of panels. In contrast, mWasabi is not significantly excited at 400 nm and thus the nucleus is much dimmer than the actin filaments in the bottom row of panels. Scale bars represent 10 μm.
Figure 5
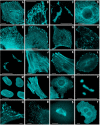
Fluorescence imaging of mTFP1 fusion constructs. (A)-(K) N-terminal fusion constructs; for each fusion protein the linker amino acid length is indicated after the name of the targeted organelle or fusion protein: (A) mTFP1-α-actinin-19 (human non-muscle); (B) mTFP1-mitochondria-7 (human cytochrome C oxidase subunit VIII); (C) mTFP1-Cx43-7 (rat α-1 connexin-43); (D) mTFP1-keratin-17 (human cytokeratin 18); (E) mTFP1-endoplasmic reticulum-3 (calreticulin signal sequence (51 nucleotides) and KDEL retention sequence); (F) mTFP1-paxillin-22 (chicken); (G) mTFP1-EB3-7 (human microtubule-associated protein; RP/EB family); (H) mTFP1-lysosomes-20 (rat lysosomal membrane glycoprotein 1); (I) mTFP1-golgi-7 (N-terminal 81 amino acids of human β-1,4-galactosyltransferase); (J) mTFP1-vimentin-7 (human); (K) mTFP1-zyxin-7 (human). (L)-(T) C-terminal fusion constructs: (L) mTFP1-focal adhesion kinase-5 (chicken protein tyrosine kinase 2); (M) mTFP1-lamin B1–10 (human); (N) mTFP1-β-actin-7; (O) mTFP1-clathrin light chain-15 (human); (P) mTFP1-fibrillarin-7 (human); (Q) mTFP1-vinculin-23 (human); (R) mTFP1-peroxisomes-2 (peroximal targeting signal 1; PTS1); (S)mTFP1-β-tubulin-6 (human); (T) mTFP1-farnesyl-5 (20-amino acid farnesylation signal from c-Ha-Ras). The cell line used for expressing mTFP1 fusion vectors was gray fox lung fibroblast cells (FoLu) in panels (A), (G), (K), (N) and Q) and human cervical adenocarcinoma cells (HeLa) in the remaining panels. Scale bars represent 10 μm.
Figure 6
Live cell imaging of mTFP1 fusion vectors. (A)-(D) Laser scanning confocal images of a single HeLa cell expressing mTFP1-H2B-6 (N-terminus; human) progressing through prophase, metaphase, anaphase and interphase, respectively. (E)-(H) Spinning disk confocal images selected from a time-lapse series of HeLa cells expressing mTFP1-annexin (A4)-12 (C-terminus; human) during ionomycin-induced translocation to the plasma and nuclear membranes [35]: (E) 0 min, ionomycin added; (F) 5 min; (G) 7 min; (H) 9 min. Scale bars represent 10 μm.
Figure 7
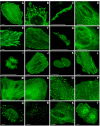
Live cell imaging of mWasabi fusion vectors. (A)-(J) N-terminal fusion constructs; for each fusion protein the linker amino acid length is indicated after the name of the targeted organelle or fusion protein: (A) mWasabi-α-actinin-19 (human non-muscle); (B) mWasabi-mitochondria-7 (human cytochrome C oxidase subunit VIII); (C) mWasabi-Cx26-7 (rat β-2 connexin-26); (D) mWasabi-keratin-17 (human cytokeratin 18); (E) mWasabi-paxillin-22 (chicken); (F) mWasabi-EB3-7 (human microtubule-associated protein; RP/EB family); (G) mWasabi-golgi-7 (N-terminal 81 amino acids of human β-1,4-galactosyltransferase); (H) mWasabi-vimentin-7 (human); (I)mWasabi-H2B-6 (human); (J) mWasabi-zyxin-7 (human). (K)-(T) C-terminal fusion constructs: (K) mWasabi-lamin B1-10 (human); (L) mWasabi-β-actin-7; (M) mWasabi-β-tubulin-6 (human); (N) mWasabi-clathrin light chain-15 (human); (O) mWasabi-vinculin-23 (human); (P) mWasabi-farnesyl-5 (20-amino acid farnesylation signal from c-Ha-Ras); (Q) mWasabi-focal adhesion kinase-5 (chicken protein tyrosine kinase 2); (R) mWasabi-peroxisomes-2 (peroximal targeting signal 1; PTS1); (S) mWasabi-endosomes-15 (human RhoB GTPase with an N-terminal c-Myc epitope tag); (T) mWasabi-annexin (A4)-15 (human). The cell line used for expressing mWasabi fusion vectors was gray fox lung fibroblast cells (FoLu) in panels (E) and (F) and human cervical adenocarcinoma cells (HeLa) in the remaining panels. Scale bars represent 10 μm.
Similar articles
- Directed evolution of a monomeric, bright and photostable version of Clavularia cyan fluorescent protein: structural characterization and applications in fluorescence imaging.
Ai HW, Henderson JN, Remington SJ, Campbell RE. Ai HW, et al. Biochem J. 2006 Dec 15;400(3):531-40. doi: 10.1042/BJ20060874. Biochem J. 2006. PMID: 16859491 Free PMC article. - Modeling spectral tuning in monomeric teal fluorescent protein mTFP1.
Topol I, Collins J, Nemukhin A. Topol I, et al. Biophys Chem. 2010 Jul;149(3):78-82. doi: 10.1016/j.bpc.2010.04.002. Epub 2010 Apr 10. Biophys Chem. 2010. PMID: 20442006 Free PMC article. - Cyan fluorescent proteins derived from mNeonGreen.
Zarowny L, Clavel D, Johannson R, Duarte K, Depernet H, Dupuy J, Baker H, Brown A, Royant A, Campbell RE. Zarowny L, et al. Protein Eng Des Sel. 2022 Feb 17;35:gzac004. doi: 10.1093/protein/gzac004. Protein Eng Des Sel. 2022. PMID: 35417013 Free PMC article. - The structure and function of fluorescent proteins.
Sample V, Newman RH, Zhang J. Sample V, et al. Chem Soc Rev. 2009 Oct;38(10):2852-64. doi: 10.1039/b913033k. Epub 2009 Aug 21. Chem Soc Rev. 2009. PMID: 19771332 Review. - Advances in fluorescent protein technology.
Shaner NC, Patterson GH, Davidson MW. Shaner NC, et al. J Cell Sci. 2007 Dec 15;120(Pt 24):4247-60. doi: 10.1242/jcs.005801. J Cell Sci. 2007. PMID: 18057027 Review.
Cited by
- Transfection of choanoflagellates illuminates their cell biology and the ancestry of animal septins.
Booth DS, Szmidt-Middleton H, King N. Booth DS, et al. Mol Biol Cell. 2018 Dec 1;29(25):3026-3038. doi: 10.1091/mbc.E18-08-0514. Epub 2018 Oct 3. Mol Biol Cell. 2018. PMID: 30281390 Free PMC article. - SuperNova, a monomeric photosensitizing fluorescent protein for chromophore-assisted light inactivation.
Takemoto K, Matsuda T, Sakai N, Fu D, Noda M, Uchiyama S, Kotera I, Arai Y, Horiuchi M, Fukui K, Ayabe T, Inagaki F, Suzuki H, Nagai T. Takemoto K, et al. Sci Rep. 2013;3:2629. doi: 10.1038/srep02629. Sci Rep. 2013. PMID: 24043132 Free PMC article. - Clathrin-mediated endocytosis cooperates with bulk endocytosis to generate vesicles.
Arpino G, Somasundaram A, Shin W, Ge L, Villareal S, Chan CY, Ashery U, Shupliakov O, Taraska JW, Wu LG. Arpino G, et al. iScience. 2022 Jan 24;25(2):103809. doi: 10.1016/j.isci.2022.103809. eCollection 2022 Feb 18. iScience. 2022. PMID: 35198874 Free PMC article. - Infection of B Cell Follicle-Resident Cells by Friend Retrovirus Occurs during Acute Infection and Is Maintained during Viral Persistence.
Windmann S, Otto L, Hrycak CP, Malyshkina A, Bongard N, David P, Gunzer M, Dittmer U, Bayer W. Windmann S, et al. mBio. 2019 Feb 19;10(1):e00004-19. doi: 10.1128/mBio.00004-19. mBio. 2019. PMID: 30782653 Free PMC article. - Optical sensors for monitoring dynamic changes of intracellular metabolite levels in mammalian cells.
Hou BH, Takanaga H, Grossmann G, Chen LQ, Qu XQ, Jones AM, Lalonde S, Schweissgut O, Wiechert W, Frommer WB. Hou BH, et al. Nat Protoc. 2011 Oct 27;6(11):1818-33. doi: 10.1038/nprot.2011.392. Nat Protoc. 2011. PMID: 22036884
References
- Wouters FS. The physics and biology of fluorescence microscopy in the life sciences. Contemp Phys. 2006;47:239–255. doi: 10.1080/00107510601089832. - DOI
Publication types
MeSH terms
Substances
LinkOut - more resources
Full Text Sources
Other Literature Sources
Research Materials


