Dynamic regulation of nucleosome positioning in the human genome - PubMed (original) (raw)
Dynamic regulation of nucleosome positioning in the human genome
Dustin E Schones et al. Cell. 2008.
Abstract
The positioning of nucleosomes with respect to DNA plays an important role in regulating transcription. However, nucleosome mapping has been performed for only limited genomic regions in humans. We have generated genome-wide maps of nucleosome positions in both resting and activated human CD4+ T cells by direct sequencing of nucleosome ends using the Solexa high-throughput sequencing technique. We find that nucleosome phasing relative to the transcription start sites is directly correlated to RNA polymerase II (Pol II) binding. Furthermore, the first nucleosome downstream of a start site exhibits differential positioning in active and silent genes. TCR signaling induces extensive nucleosome reorganization in promoters and enhancers to allow transcriptional activation or repression. Our results suggest that H2A.Z-containing and modified nucleosomes are preferentially lost from the -1 nucleosome position. Our data provide a comprehensive view of the nucleosome landscape and its dynamic regulation in the human genome.
Figures
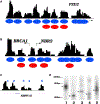
Figure 1.. The Solexa Sequencing Tags Define Nucleosome Boundaries in the Human Genome
(A) Nucleosome profile at the FZD2 promoter. The mononucleosome-sized DNA was isolated from MNase-digested chromatin of human T cells and sequenced to read 25 bp from the end using the Solexa sequencing technique. The sequence reads mapped to a given region were used to generate the nucleosome profiles using a scoring function (see Experimental Procedures) as shown by the black track. Blue ovals indicate inferred nucleosome positions in this study and red ovals indicate nucleosome positions identified previously (Ozsolak et al., 2007). (B) Nucleosome profile at the BRCA1 and NBR2 promoters. (C) Nucleosomes identified in the gene body of NBPF10 (region shown is chr1:16763501–16764673). (D) Confirmation of nucleosome boundaries using LM-PCR. The mononucleosome DNA was ligated to a pair of Solexa adaptors, followed by amplification using one Solexa primer and one sequence-specific primer recognizing one of the nucleosomes indicated in Figure 1C. The product was labeled using a 32P-labeled nested primer, resolved by polyacrylamide gel electrophoresis, and visualized by exposing to X-ray films. An arrowhead indicates the major nucleosome boundaries.
Figure 2.. Nucleosomes near the TSS of Actively Transcribed Genes Are Strongly Phased
(A) The nucleosomes near the TSS of expressed genes are phased with respect to the TSS. The y axis shows the normalized number of sequence tags from the sense strand (red) and antisense strand (green) of DNA at each position. The inferred nucleosomes are shown by the filled ovals that are numbered as indicated. (B) Only one well-positioned nucleosome exists near the TSS of unexpressed genes (see panel A for details). (C) Histone distribution surrounding the TSS of expressed genes analyzed by ChIP-Seq using an H3 antibody and crosslinked and sonicated chromatin. The y axis shows the normalized number of sequence tags from the sense strand (red) and antisense strand (green) of DNA at each position. (D) The +1 nucleosomes are differentially positioned in expressed and unexpressed genes. The nucleosome tags from the sense strand of DNA of expressed (indicated as 5′ Exp Nuc, red) and unexpressed (indicated as 5′ Non Nuc, blue) genes are shown. The Pol II tags obtained from the ChIP-Seq analysis (Barski et al., 2007) are also shown for the expressed and unexpressed genes.
Figure 3.. Promoters with Stalled Pol II Exhibit Similar Patterns of Nucleosome Phasing to the Promoters with Elongating Pol II
(A) Expression patterns of the genes with elongating, stalled, or no Pol II (see Experimental Procedures for details). The y axis indicates the number of genes exhibiting the expression level shown by the x axis. (B) The nucleosome pattern near the TSS of the genes with elongating Pol II. The y axis shows the normalized number of sequence tags from the sense strand (red) and antisense strand (green) of DNA at each position. (C) The nucleosome pattern near the TSS of the genes with stalled Pol II in the promoter region. (D) The nucleosome pattern near the TSS of the genes without any Pol II binding in the promoter region.
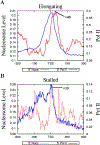
Figure 4.. The Distinct Nucleosome Positioning Patterns at Poised and Elongating Promoters
(A) Nucleosome positioning and Pol II binding at elongating promoters. (B) Nucleosome positioning and Pol II binding at poised promoters. The peak of the +1 nucleosome position is indicated in both panels.
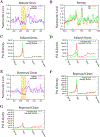
Figure 5.. Nucleosome Reorganization at Genes Induced and Repressed by TCR Signaling
(A) Nucleosome profiles in resting and activated T cells for genes induced by TCR signaling. The y axis shows the normalized number of sequence tags from the sense strand of DNA of induced genes in resting (blue) and activated (red) T cells in 5 bp windows. Highlighted region indicates the −1 nucleosome position. (B) Comparison of nucleosome levels between the expressed and inducible genes in resting T cells. (C) Pol II density as determined by performing ChIP-Seq for Pol II using antibodies against Ser5 phosphorylated and unphosphorylated Pol II in resting T cells across genes induced by TCR signaling. (D) Pol II density for Ser5 phosphorylated and unphosphorylated Pol II in activated T cells across genes induced by TCR signaling. (E) Nucleosome profiles in resting and activated T cells for genes repressed by TCR signaling. The y axis shows the number of sequence tags from the sense strand of DNA of repressed genes in resting (blue) and activated (red) T cells. Highlighted region indicates the −1 nucleosome position. (F) Pol II density for Ser5 phosphorylated and unphosphorylated Pol II in resting T cells across genes repressed by TCR signaling. (G) Pol II density for Ser5 phosphorylated and unphosphorylated Pol II in activated T cells across genes repressed by TCR signaling.
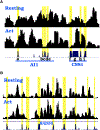
Figure 6.. Nucleosome Reorganization at Functional Enhancers
(A) Nucleosome profiles in resting and activated T cells near the functional enhancer elements CNS1 and AI1. CNS1 and AI1 regions are indicated below the nucleosome profiles. The CNSs are alphabetically labeled and their correspondence to nucleosome structure is highlighted in yellow. Region shown is chr5:132,026,345–132,028,199. (B) Nucleosome profiles in resting and activated T cells in an intron of the RAD50 gene. The correspondence of CNSs in this locus to nucleosome linker regions is highlighted in yellow. Region shown is chr5:131,960,529–131,964,566.
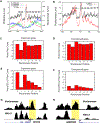
Figure 7.. Modification Profiles and Nucleosome Loss of Individual Nucleosomes near the TSS
(A) Methylation of H3K4 near the TSSs of actively transcribed genes (data from Barski et al., 2007) overlaid with nucleosome positions. The sequence tags from the sense strand are shown for nucleosomes (black), H3K4me3 (red), H3K4me2 (green), and H3K4me1 (blue). H3K4me3 marks the −2, +1, +2, and +3 nucleosomes, H3K4me2 marks the +3 and +4 nucleosomes, and H3K4me1 marks the +5 and +6 nucleosomes. (B) Histone variant H2A.Z marks the −3, −2, +1, +2, and +3 nucleosomes in actively transcribed genes. (C) Quantification of the nucleosome levels by counting the sequence tags at the nucleosome positions (indicated in Figure 2A) for actively transcribed genes in resting T cells. (D) Quantification of the nucleosome levels by counting the sequence tags at the nucleosome positions (indicated in Figure 2A) for silent genes in resting T cells. (E) Quantification of the H2A.Z nucleosome levels by counting the sequence tags obtained from the ChIP-Seq analysis (Barski et al., 2007) at the nucleosome positions (indicated in Figure 2A) for actively transcribed genes in resting T cells. (F) Quantification of the H2A.Z nucleosome levels by counting the sequence tags obtained from ChIP-Seq analysis (Barski et al., 2007) at the nucleosome positions (indicated in Figure 2A) for silent genes in resting T cells. (G) Total nucleosomes and H2A.Z-containing nucleosomes near the TSS of the CDC23 gene in resting T cells. The −1 nucleosome region is highlighted. (H) Total nucleosomes and H2A.Z-containing nucleosomes near the TSS of the ADIPOR2 gene in resting T cells. The −1 nucleosome region is highlighted.
Similar articles
- Histone variant selectivity at the transcription start site: H2A.Z or H2A.Lap1.
Nekrasov M, Soboleva TA, Jack C, Tremethick DJ. Nekrasov M, et al. Nucleus. 2013 Nov-Dec;4(6):431-8. doi: 10.4161/nucl.26862. Epub 2013 Nov 8. Nucleus. 2013. PMID: 24213378 Free PMC article. - H2A.Z nucleosome positioning has no impact on genetic variation in Drosophila genome.
Tang Y, Dong S, Cao X, Zhou Q, Ding G, Jiang C. Tang Y, et al. PLoS One. 2013;8(3):e58295. doi: 10.1371/journal.pone.0058295. Epub 2013 Mar 5. PLoS One. 2013. PMID: 23472174 Free PMC article. - Nucleosome organization in the Drosophila genome.
Mavrich TN, Jiang C, Ioshikhes IP, Li X, Venters BJ, Zanton SJ, Tomsho LP, Qi J, Glaser RL, Schuster SC, Gilmour DS, Albert I, Pugh BF. Mavrich TN, et al. Nature. 2008 May 15;453(7193):358-62. doi: 10.1038/nature06929. Epub 2008 Apr 13. Nature. 2008. PMID: 18408708 Free PMC article. - Nucleosome positioning in yeasts: methods, maps, and mechanisms.
Lieleg C, Krietenstein N, Walker M, Korber P. Lieleg C, et al. Chromosoma. 2015 Jun;124(2):131-51. doi: 10.1007/s00412-014-0501-x. Epub 2014 Dec 23. Chromosoma. 2015. PMID: 25529773 Review. - Primary Role of the Nucleosome.
Kornberg RD, Lorch Y. Kornberg RD, et al. Mol Cell. 2020 Aug 6;79(3):371-375. doi: 10.1016/j.molcel.2020.07.020. Mol Cell. 2020. PMID: 32763226 Review.
Cited by
- NucleoFinder: a statistical approach for the detection of nucleosome positions.
Becker J, Yau C, Hancock JM, Holmes CC. Becker J, et al. Bioinformatics. 2013 Mar 15;29(6):711-6. doi: 10.1093/bioinformatics/bts719. Epub 2013 Jan 6. Bioinformatics. 2013. PMID: 23297036 Free PMC article. - Epigenetic regulation of inducible gene expression in the immune system.
Lim PS, Li J, Holloway AF, Rao S. Lim PS, et al. Immunology. 2013 Jul;139(3):285-93. doi: 10.1111/imm.12100. Immunology. 2013. PMID: 23521628 Free PMC article. Review. - Histone H2A.Z inheritance during the cell cycle and its impact on promoter organization and dynamics.
Nekrasov M, Amrichova J, Parker BJ, Soboleva TA, Jack C, Williams R, Huttley GA, Tremethick DJ. Nekrasov M, et al. Nat Struct Mol Biol. 2012 Nov;19(11):1076-83. doi: 10.1038/nsmb.2424. Epub 2012 Oct 21. Nat Struct Mol Biol. 2012. PMID: 23085713 - Open chromatin structures regulate the efficiencies of pre-RC formation and replication initiation in Epstein-Barr virus.
Papior P, Arteaga-Salas JM, Günther T, Grundhoff A, Schepers A. Papior P, et al. J Cell Biol. 2012 Aug 20;198(4):509-28. doi: 10.1083/jcb.201109105. Epub 2012 Aug 13. J Cell Biol. 2012. PMID: 22891264 Free PMC article. - The Need for a Human Pangenome Reference Sequence.
Miga KH, Wang T. Miga KH, et al. Annu Rev Genomics Hum Genet. 2021 Aug 31;22:81-102. doi: 10.1146/annurev-genom-120120-081921. Epub 2021 Apr 30. Annu Rev Genomics Hum Genet. 2021. PMID: 33929893 Free PMC article. Review.
References
- Affymetrix N (2002). Statistical Algorithms Description Document. http://www.affymetrix.com/support/technical/whitepapers/sadd_whitepaper.pdf.
- Albert I, Mavrich TN, Tomsho LP, Qi J, Zanton SJ, Schuster SC, and Pugh BF (2007). Translational and rotational settings of H2A.Z nucleosomes across the Saccharomyces cerevisiae genome. Nature 446, 572–576. - PubMed
- Barski A, Cuddapah S, Cui K, Roh TY, Schones DE, Wang Z, Wei G, Chepelev I, and Zhao N (2007). High-resolution profiling of histone methylations in the human genome. Cell 129, 823–837. - PubMed
- Berger SL (2002). Histone modifications in transcriptional regulation. Curr. Opin. Genet. Dev 12, 142–148. - PubMed
Publication types
MeSH terms
Substances
LinkOut - more resources
Full Text Sources
Other Literature Sources
Molecular Biology Databases
Research Materials
