NELF and GAGA factor are linked to promoter-proximal pausing at many genes in Drosophila - PubMed (original) (raw)
NELF and GAGA factor are linked to promoter-proximal pausing at many genes in Drosophila
Chanhyo Lee et al. Mol Cell Biol. 2008 May.
Abstract
Recent analyses of RNA polymerase II (Pol II) revealed that Pol II is concentrated at the promoters of many active and inactive genes. NELF causes Pol II to pause in the promoter-proximal region of the hsp70 gene in Drosophila melanogaster. In this study, genome-wide location analysis (chromatin immunoprecipitation-microarray chip [ChIP-chip] analysis) revealed that NELF is concentrated at the 5' ends of 2,111 genes in Drosophila cells. Permanganate genomic footprinting was used to determine if paused Pol II colocalized with NELF. Forty-six of 56 genes with NELF were found to have paused Pol II. Pol II pauses 30 to 50 nucleotides downstream from transcription start sites. Analysis of DNA sequences in the vicinity of paused Pol II identified a conserved DNA sequence that probably associates with TFIID but detected no evidence of RNA secondary structures or other conserved sequences that might directly control elongation. ChIP-chip experiments indicate that GAGA factor associates with 39% of the genes that have NELF. Surprisingly, NELF associates with almost one-half of the most highly expressed genes, indicating that NELF is not necessarily a repressor of gene expression. NELF-associated pausing of Pol II might be an obligatory but sometimes transient checkpoint during the transcription cycle.
Figures
FIG. 1.
Comparison of the distributions of NELF and paused Pol II. In each panel, the bar graphs for NELF-E and NELF-B represent ChIP signals at individual probe coordinates. Regions lacking bars represent no statistically significant signal above the preimmune control signal. The MnO4− graph in each panel is derived from SAFA analysis (13) of the permanganate footprinting data shown in Fig. 3. The enhancement in permanganate reactivity that occurred in cells was determined by subtracting the band intensities for naked DNA from the corresponding band intensities obtained for treated cells. The regions analyzed by permanganate footprinting are limited to regions of approximately 100 nucleotides. The graphs were aligned with each other and with an annotated view of the corresponding region of the genome by using the UCSC browser. Numbers at the top of each panel designate coordinates on the chromosome indicated to the left of the panel. CG14709, CG5807, and CG31531 are examples where the densities of NELF are significantly elevated in a 500- to 1,000-base-pair region at the 5′ end of a gene. Bap170, Cctgamma, and Nipsnap are examples where the densities of NELF are above a 1% false discovery rate but evenly distributed over 2 to 3 kb; no permanganate footprint was evident in these promoter regions (Fig. 3). The solid horizontal bars delineate transcription units, and the arrowheads indicate the direction of transcription. Results for 59 regions are provided in File S1 in the supplemental material.
FIG. 2.
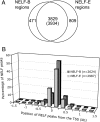
Analysis of distribution of NELF. (A) Venn diagram showing the number of NELF-E regions that overlap NELF-B regions by at least 1 kb and visa versa. Regions correspond to places where contiguous probes on the microarray yielded signals above a 1% false discovery rate and include regions that contain peaks as well as low even distributions, as shown in Fig. 1. The P value for the chance occurrence of this overlap is <10−300. The number not in parentheses (3,829) is the number of NELF-B regions overlapping NELF-E regions. The number in parentheses (3,934) is the number of NELF-E regions overlapping NELF-B regions. In some cases, two separate regions for one protein overlap one region for the other protein. (B) Positions of NELF peaks relative to transcription start sites. NELF-B (n = 2,624) and NELF-E (n = 2,987) peaks were located using Mpeak. Note that there are fewer peaks than regions (A) because many regions lack a discernible peak of NELF.
FIG. 3.
Permanganate genomic footprints for selected genes. Drosophila cells were subjected to permanganate genomic footprinting, and the resulting patterns of reactivity were analyzed on DNA sequencing gels. The rightmost lane in each panel shows the pattern of reactivity occurring in cells; the leftmost lane shows GA markers. The center lanes show controls done with purified DNA (naked DNA). The numbers to the right of each panel identify locations of thymines relative to the transcription start sites annotated in the Drosophila genome. Some thymines have not been marked to simplify the display; all are labeled in File S1 in the supplemental material. The thymines deemed hyperreactive are printed in black; the rest are shown in gray. The short vertical lines adjacent to CG14709 (at positions −22), CG5807 (between positions +30 and +45), and CG31531 (at position +3) delineate initiator elements identified in Fig. 4. The footprinting results are for those genes displayed in Fig. 1. Footprinting results for an additional 53 loci are provided in File S1 in the supplemental material.
FIG. 4.
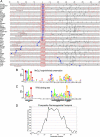
Sequence conservation and alignment of permanganate footprints with initiator elements. (A) Schematics of regions encompassing permanganate footprints were aligned relative to putative initiator elements. The putative initiator elements matched at least four of five positions of previously characterized Drosophila initiator elements (9, 32). Those tagged with an asterisk contain the conserved motif shown in panel B. Those tagged with the symbol “#” contain the conserved GAGA element displayed in Fig. 5A. Three of the promoters (scyl, β_1-tubulin_, and hsp26) lack the conserved initiator, so they were aligned on the annotated start site. The annotated start sites from FlyBase are marked with thick blue vertical lines; note that several cases do not align with an initiator element. Those cases lacking a thick blue line have annotated transcription start sites that fall outside the illustrated region. Black vertical lines mark the locations of hyperreactive thymines that constitute the permanganate footprint, and red vertical lines mark the positions of the remaining thymines. (B) Conserved element detected in the vicinity of the permanganate footprints (MnO4− footprint-linked conservation). Sequence conservation was based on the MEME results shown in File S7 in the supplemental material and displayed using WebLogo (
). P values for regions containing this motif were 5 × 10⁻⁷ or lower. (C) Composite sequence of putative TFIID binding sites (Inr, MTE, and DPE) derived from a statistical analysis of 3,393 nonredundant Drosophila promoters (16). (D) Average percentage of hyperreactive thymines at each position relative to the initiator element. Thymines in the regions encompassing the permanganate footprints were given a score of 1 if they were judged to be hyperreactive and a score of 0 if not. The percentage of hyperreactive thymines in a three-nucleotide window was calculated, and the percentage at the center nucleotide of the three-nucleotide window was plotted as a function of distance from the adenine in the initiator.
FIG. 5.
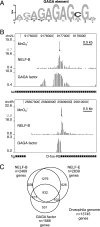
Comparison of NELF and GAGA factor distributions. (A) Conserved sequence motif identified in the vicinity of regions with a permanganate footprint. MEME analysis of the region from 200 nucleotides upstream to 100 nucleotides downstream from the Inr elements detected enrichment of the GAGA element. P values for regions containing this motif were 3.76 × 10⁻⁵ or lower. (B) Permanganate footprints and distributions of NELF-B and GAGA factor on the tai and D-fos genes. The footprinted region of tai is approximately 9 kb downstream from the annotated transcription start site. Nevertheless, the presence of an initiator element (Fig. 4) indicates that this could be a transcription start site. (C) Venn diagram displaying the relationships between genes associated with NELF-B, NELF-E, and GAGA factor. Separate lists were compiled for genes that had a peak of NELF-B or NELF-E within 500 base pairs of the transcription start site or of GAGA factor within 1,000 base pairs of the transcription start site (see File S6 in the supplemental material).
FIG. 6.
Relationship between gene expression level and NELF. Data from the work of Rehwinkel et al. (49) were used to rank 13,701 genes according to expression level. The percentage of genes in each bin of 10 percentile points with a NELF-B peak within 500 bp of the start was plotted against the percentile of expression. Each bin contains approximately 1,370 genes.
FIG. 7.
Relationships between NELF-associated genes, GAGA factor-associated genes, and genes with stalled Pol II. NELF-associated genes are those genes that have both NELF-B and NELF-E peaks within 500 bp of the transcription start. GAGA factor-associated genes were identified as described in the legend to Fig. 5. Genes with stalled Pol II were identified by Muse et al. (38). Only 983 of the 1,014 genes with stalled Pol II could be matched up with our set of 13,745 genes. File S6 in the supplemental material provides a list of genes with associated factors.
Similar articles
- Kinetic competition between elongation rate and binding of NELF controls promoter-proximal pausing.
Li J, Liu Y, Rhee HS, Ghosh SK, Bai L, Pugh BF, Gilmour DS. Li J, et al. Mol Cell. 2013 Jun 6;50(5):711-22. doi: 10.1016/j.molcel.2013.05.016. Mol Cell. 2013. PMID: 23746353 Free PMC article. - NELF and DSIF cause promoter proximal pausing on the hsp70 promoter in Drosophila.
Wu CH, Yamaguchi Y, Benjamin LR, Horvat-Gordon M, Washinsky J, Enerly E, Larsson J, Lambertsson A, Handa H, Gilmour D. Wu CH, et al. Genes Dev. 2003 Jun 1;17(11):1402-14. doi: 10.1101/gad.1091403. Genes Dev. 2003. PMID: 12782658 Free PMC article. - NELF-mediated stalling of Pol II can enhance gene expression by blocking promoter-proximal nucleosome assembly.
Gilchrist DA, Nechaev S, Lee C, Ghosh SK, Collins JB, Li L, Gilmour DS, Adelman K. Gilchrist DA, et al. Genes Dev. 2008 Jul 15;22(14):1921-33. doi: 10.1101/gad.1643208. Genes Dev. 2008. PMID: 18628398 Free PMC article. - Promoter proximal pausing on genes in metazoans.
Gilmour DS. Gilmour DS. Chromosoma. 2009 Feb;118(1):1-10. doi: 10.1007/s00412-008-0182-4. Epub 2008 Oct 2. Chromosoma. 2009. PMID: 18830703 Review. - Regulation of snRNA gene expression by the Drosophila melanogaster small nuclear RNA activating protein complex (DmSNAPc).
Hung KH, Stumph WE. Hung KH, et al. Crit Rev Biochem Mol Biol. 2011 Feb;46(1):11-26. doi: 10.3109/10409238.2010.518136. Epub 2010 Oct 6. Crit Rev Biochem Mol Biol. 2011. PMID: 20925482 Review.
Cited by
- Ups and Downs of Poised RNA Polymerase II in B-Cells.
Dao P, Wojtowicz D, Nelson S, Levens D, Przytycka TM. Dao P, et al. PLoS Comput Biol. 2016 Apr 14;12(4):e1004821. doi: 10.1371/journal.pcbi.1004821. eCollection 2016 Apr. PLoS Comput Biol. 2016. PMID: 27078128 Free PMC article. - DSIF, the Paf1 complex, and Tat-SF1 have nonredundant, cooperative roles in RNA polymerase II elongation.
Chen Y, Yamaguchi Y, Tsugeno Y, Yamamoto J, Yamada T, Nakamura M, Hisatake K, Handa H. Chen Y, et al. Genes Dev. 2009 Dec 1;23(23):2765-77. doi: 10.1101/gad.1834709. Genes Dev. 2009. PMID: 19952111 Free PMC article. - Model-based characterization of the equilibrium dynamics of transcription initiation and promoter-proximal pausing in human cells.
Zhao Y, Liu L, Hassett R, Siepel A. Zhao Y, et al. Nucleic Acids Res. 2023 Nov 27;51(21):e106. doi: 10.1093/nar/gkad843. Nucleic Acids Res. 2023. PMID: 37889042 Free PMC article. - Promoter-proximal pausing mediated by the exon junction complex regulates splicing.
Akhtar J, Kreim N, Marini F, Mohana G, Brüne D, Binder H, Roignant JY. Akhtar J, et al. Nat Commun. 2019 Jan 31;10(1):521. doi: 10.1038/s41467-019-08381-0. Nat Commun. 2019. PMID: 30705266 Free PMC article. - Collaborative repressive action of the antagonistic ETS transcription factors Pointed and Yan fine-tunes gene expression to confer robustness in Drosophila.
Webber JL, Zhang J, Massey A, Sanchez-Luege N, Rebay I. Webber JL, et al. Development. 2018 Jul 2;145(13):dev165985. doi: 10.1242/dev.165985. Development. 2018. PMID: 29848501 Free PMC article.
References
- Aiyar, S. E., J. L. Sun, A. L. Blair, C. A. Moskaluk, Y. Z. Lu, Q. N. Ye, Y. Yamaguchi, A. Mukherjee, D. M. Ren, H. Handa, and R. Li. 2004. Attenuation of estrogen receptor alpha-mediated transcription through estrogen-stimulated recruitment of a negative elongation factor. Genes Dev. 182134-2146. - PMC - PubMed
Publication types
MeSH terms
Substances
Grants and funding
- HG004160/HG/NHGRI NIH HHS/United States
- R01 GM047477/GM/NIGMS NIH HHS/United States
- GM47477/GM/NIGMS NIH HHS/United States
- R01 GM070444/GM/NIGMS NIH HHS/United States
- GM704403/GM/NIGMS NIH HHS/United States
- R01 HG004160/HG/NHGRI NIH HHS/United States
LinkOut - more resources
Full Text Sources
Other Literature Sources
Molecular Biology Databases


