Enhancing therapeutic vaccination by blocking PD-1-mediated inhibitory signals during chronic infection - PubMed (original) (raw)
Enhancing therapeutic vaccination by blocking PD-1-mediated inhibitory signals during chronic infection
Sang-Jun Ha et al. J Exp Med. 2008.
Abstract
Therapeutic vaccination is a potentially promising strategy to enhance T cell immunity and viral control in chronically infected individuals. However, therapeutic vaccination approaches have fallen short of expectations, and effective boosting of antiviral T cell responses has not always been observed. One of the principal reasons for the limited success of therapeutic vaccination is that virus-specific T cells become functionally exhausted during chronic infections. We now provide a novel strategy for enhancing the efficacy of therapeutic vaccines. In this study, we show that blocking programmed death (PD)-1/PD-L1 inhibitory signals on exhausted CD8(+) T cells, in combination with therapeutic vaccination, synergistically enhances functional CD8(+) T cell responses and improves viral control in mice chronically infected with lymphocytic choriomeningitis virus. This combinatorial therapeutic vaccination was effective even in the absence of CD4(+) T cell help. Thus, our study defines a potent new approach to augment the efficacy of therapeutic vaccination by blocking negative signals. Such an approach may have broad applications in developing treatment strategies for chronic infections in general, and perhaps also for tumors.
Figures
Figure 1.
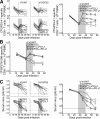
Synergistic effect of PD-L1 blockade and therapeutic vaccination on T cell responses and viral control. LCMV CL-13–infected mice were vaccinated with wild-type vaccinia virus (VV/WT) or LCMV GP33-41 epitope-expressing vaccinia virus (VV/GP33) at 4 wk after infection (vertical line). Cohorts of mice were also treated for 12 d with αPD-L1, starting at 4 wk after infection (shaded region). The number of DbGP33-41 (A) and DbGP276-286 tetramer-positive cells (B) or viral titer (C) was determined in the blood at the indicated time points. The numbers of DbGP33-41 tetramer-specific CD8+ T cells and viral titers from individual mice are depicted on the left in A and C. Dashed lines represent virus detection limit. Results are pooled from three independent experiments.
Figure 2.
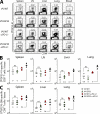
Expansion of epitope-specific CD8+ T cells in multiple tissues. (A) The frequency and total number of DbGP33-41 (B) and DbGP276-286 (C) tetramer-positive cells in the indicated tissues at 2 wk after therapy. Data are representative of two independent experiments. n = 3 mice per group in each experiment. Results are pooled from two experiments. *, P < 0.05; **, P < 0.01.
Figure 3.
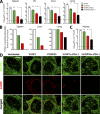
Enhanced viral control in tissues after combinatorial therapeutic vaccination. (A) Viral titers in the indicated tissues at 2 wk after therapy. Dashed lines represent virus detection limit. (B) Percentage of mice containing virus above detectable limit in different tissues at 4 wk after therapy. (C) Viral titers in the kidney at a later time point (14 wk after therapy). n = 6 mice per group. Results are pooled from two experiments. ns, P > 0.05; *, P < 0.05; **, P < 0.01. (D) Immunostaining of spleen with ERTR7 (green) and αLCMV antigens (red) at 2 wk after therapy. Bar, 100 μm.
Figure 4.
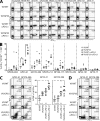
Function of exhausted CD8+ T cells after therapeutic vaccination and PD-L1 blockade. (A) IFN-γ production and degranulation by CD8+ T cells in vaccinated mice at 2 wk after therapy. Splenocytes were stimulated with the indicated peptides in the presence of αCD107a/b antibodies, and then costained for IFN-γ. The cells shown in plots are gated on CD8+ T cells. (B) The percentages of IFN-γ+CD107+ CD8+ T cells specific for each of the LCMV peptides from A are summarized for multiple mice (n = 6 per group). TNF-α (C) and IL-2 (D) production by IFN-γ+ CD8+ T cells in vaccinated mice at 2 wk after therapy. Splenocytes were stimulated with GP33-41 or GP276-286 peptides. Percentages of cytokine-producing cells among CD8+ T cells are shown in the plots and numbers in parentheses on plots indicate the percentages of cytokine coproducers out of the total IFN-γ+ population. (C, right) Summarizes the data for multiple mice (n = 6 for each response). *, P < 0.05; **, P < 0.01.
Figure 5.
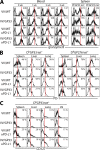
Phenotypic changes in antigen-specific CD8+ T cells after combinatorial therapeutic vaccination. (A) Expression of granzyme B on DbGP33-41 tetramer-positive cells in PBMC at the indicated times after therapy and on DbGP33-41 or DbGP276-286 tetramer-positive cells in spleen at 4 wk after therapy. Open histograms, granzyme B; filled histograms, isotype control. Numbers represent mean fluorescence intensity of granzyme B expression. PD-1 expression on DbGP33-41 or DbGP276-286 tetramer-positive cells (B) and CD127 expression on DbGP33-41 tetramer-positive cells (C) in different tissues at 4 wk after therapy. Numbers represent the frequency of tetramer-positive cells expressing CD127 or PD-1. The data are representative of two independent experiments.
Figure 6.
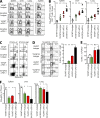
Combinatorial therapeutic vaccination enhances CD8+ T cell responses in the absence of CD4+ T cells. Mice were depleted of CD4+ T cells, infected with LCMV CL-13, and vaccinated with VV/WT or VV/GP33 at 7–10-wk after infection, with or without αPD-L1 treatment. 2 wk after treatment, mice were killed for analysis. (A) BrdU incorporation in different tissues. The ratio of BrdU-negative and -positive cells on DbGP33-41 tetramer-positive cells and the frequency of tetramer-positive cells are shown on plots. (B) Total number of DbGP33-41 tetramer-positive cells in different tissues. (C) Live/dead analysis of DbGP33-41 tetramer-positive cells in spleen by Annexin V and PI staining. (D) IFN-γ and CD107 expression by GP33-specific CD8+ T cells in the spleen after treatment. (E) Proportion GP33-specific CD8+ T cells producing IFN-γ in the spleen. (F) Viral titers in the indicated tissues. All plots are representative of two experiments and summarized results are pooled from two experiments (n = 6 mice per group). *, P < 0.05; **, P < 0.01.
Figure 7.
Improved antigen presentation after therapeutic vaccination of chronically infected mice. (A) Mice chronically infected with LCMV CL-13 (7 wk after infection) were vaccinated with VV/WT or VV/GP33. 1 d later, DCs were isolated from spleens of both groups of mice and co-cultured with CFSE-labeled P14 Thy1.1+CD8+ T cells. (B) Proliferation of P14 cells was analyzed at day 3 (top) and 5 (bottom) after co-culture. Data are representative from three different samples. The percentage of cells showing more than four divisions is indicated in the top left corner of each histogram.
Similar articles
- Antigen-specific CD4 T-cell help rescues exhausted CD8 T cells during chronic viral infection.
Aubert RD, Kamphorst AO, Sarkar S, Vezys V, Ha SJ, Barber DL, Ye L, Sharpe AH, Freeman GJ, Ahmed R. Aubert RD, et al. Proc Natl Acad Sci U S A. 2011 Dec 27;108(52):21182-7. doi: 10.1073/pnas.1118450109. Epub 2011 Dec 12. Proc Natl Acad Sci U S A. 2011. PMID: 22160724 Free PMC article. - Functional restoration of exhausted CD4(+) and CD8(+) T cells in chronic viral infection by vinegar-processed flos of Daphne genkwa.
Uyangaa E, Choi JY, Patil AM, Kim JH, Kim SB, Kim K, Ryu HW, Oh SR, Eo SK. Uyangaa E, et al. Comp Immunol Microbiol Infect Dis. 2015 Apr;39:25-37. doi: 10.1016/j.cimid.2015.02.001. Epub 2015 Feb 16. Comp Immunol Microbiol Infect Dis. 2015. PMID: 25744061 - PD-L1 blockade synergizes with IL-2 therapy in reinvigorating exhausted T cells.
West EE, Jin HT, Rasheed AU, Penaloza-Macmaster P, Ha SJ, Tan WG, Youngblood B, Freeman GJ, Smith KA, Ahmed R. West EE, et al. J Clin Invest. 2013 Jun;123(6):2604-15. doi: 10.1172/JCI67008. Epub 2013 May 15. J Clin Invest. 2013. PMID: 23676462 Free PMC article. - Manipulating both the inhibitory and stimulatory immune system towards the success of therapeutic vaccination against chronic viral infections.
Ha SJ, West EE, Araki K, Smith KA, Ahmed R. Ha SJ, et al. Immunol Rev. 2008 Jun;223:317-33. doi: 10.1111/j.1600-065X.2008.00638.x. Immunol Rev. 2008. PMID: 18613845 Review. - Therapeutic vaccination against chronic viral infection: the importance of cooperation between CD4+ and CD8+ T cells.
Zajac AJ, Murali-Krishna K, Blattman JN, Ahmed R. Zajac AJ, et al. Curr Opin Immunol. 1998 Aug;10(4):444-9. doi: 10.1016/s0952-7915(98)80119-2. Curr Opin Immunol. 1998. PMID: 9722921 Review.
Cited by
- CEA/CD3-bispecific T cell-engaging (BiTE) antibody-mediated T lymphocyte cytotoxicity maximized by inhibition of both PD1 and PD-L1.
Osada T, Patel SP, Hammond SA, Osada K, Morse MA, Lyerly HK. Osada T, et al. Cancer Immunol Immunother. 2015 Jun;64(6):677-88. doi: 10.1007/s00262-015-1671-y. Epub 2015 Mar 6. Cancer Immunol Immunother. 2015. PMID: 25742933 Free PMC article. - HIV infection: what should be considered in approaches for a cure?
Levy JA, Levy Y. Levy JA, et al. AIDS. 2012 Nov 13;26(17):2253-5. doi: 10.1097/QAD.0b013e32835ac83a. AIDS. 2012. PMID: 23060292 Free PMC article. No abstract available. - Adenovirus Encoding Tumor Necrosis Factor Alpha and Interleukin 2 Induces a Tertiary Lymphoid Structure Signature in Immune Checkpoint Inhibitor Refractory Head and Neck Cancer.
Clubb JHA, Kudling TV, Heiniö C, Basnet S, Pakola S, Cervera Carrascón V, Santos JM, Quixabeira DCA, Havunen R, Sorsa S, Zheng V, Salo T, Bäck L, Aro K, Tulokas S, Loimu V, Hemminki A. Clubb JHA, et al. Front Immunol. 2022 Mar 7;13:794251. doi: 10.3389/fimmu.2022.794251. eCollection 2022. Front Immunol. 2022. PMID: 35355980 Free PMC article. - Immunology and the elusive AIDS vaccine.
Virgin HW, Walker BD. Virgin HW, et al. Nature. 2010 Mar 11;464(7286):224-31. doi: 10.1038/nature08898. Nature. 2010. PMID: 20220841 - Expression profile and in vitro blockade of programmed death-1 in human papillomavirus-negative head and neck squamous cell carcinoma.
Malm IJ, Bruno TC, Fu J, Zeng Q, Taube JM, Westra W, Pardoll D, Drake CG, Kim YJ. Malm IJ, et al. Head Neck. 2015 Aug;37(8):1088-95. doi: 10.1002/hed.23706. Epub 2014 Sep 16. Head Neck. 2015. PMID: 24710745 Free PMC article.
References
- Klenerman, P., and A. Hill. 2005. T cells and viral persistence: lessons from diverse infections. Nat. Immunol. 6:873–879. - PubMed
- Gandhi, R.T., and B.D. Walker. 2002. Promises and pitfalls in the reconstitution of immunity in patients who have HIV-1 infection. Curr. Opin. Immunol. 14:487–494. - PubMed
- Rehermann, B., and M. Nascimbeni. 2005. Immunology of hepatitis B virus and hepatitis C virus infection. Nat. Rev. Immunol. 5:215–229. - PubMed
Publication types
MeSH terms
Substances
LinkOut - more resources
Full Text Sources
Other Literature Sources
Research Materials
