A natural antisense transcript regulates Zeb2/Sip1 gene expression during Snail1-induced epithelial-mesenchymal transition - PubMed (original) (raw)
Comparative Study
. 2008 Mar 15;22(6):756-69.
doi: 10.1101/gad.455708.
Affiliations
- PMID: 18347095
- PMCID: PMC2275429
- DOI: 10.1101/gad.455708
Comparative Study
A natural antisense transcript regulates Zeb2/Sip1 gene expression during Snail1-induced epithelial-mesenchymal transition
Manuel Beltran et al. Genes Dev. 2008.
Abstract
Expression of Snail1 in epithelial cells triggers an epithelial-mesenchymal transition (EMT). Here, we demonstrate that the synthesis of Zeb2, a transcriptional repressor of E-cadherin, is up-regulated after Snail1-induced EMT. Snail1 does not affect the synthesis of Zeb2 mRNA, but prevents the processing of a large intron located in its 5'-untranslated region (UTR). This intron contains an internal ribosome entry site (IRES) necessary for the expression of Zeb2. Maintenance of 5'-UTR Zeb2 intron is dependent on the expression of a natural antisense transcript (NAT) that overlaps the 5' splice site in the intron. Ectopic overexpression of this NAT in epithelial cells prevents splicing of the Zeb2 5'-UTR, increases the levels of Zeb2 protein, and consequently down-regulates E-cadherin mRNA and protein. The relevance of these results is demonstrated by the strong association between NAT presence and conservation of the 5'-UTR intron in cells that have undergone EMT or in human tumors with low E-cadherin expression. Therefore, the results presented in this article reveal the existence of a NAT capable of activating Zeb2 expression, explain the mechanism involved in this activation, and demonstrate that this NAT regulates E-cadherin expression.
Figures
Figure 1.
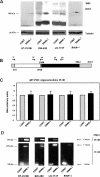
Zeb2 protein is increased in Snail1 transfectants by a post-transcriptional mechanism. (A) Total cell extracts were prepared from HT-29 M6, SW-480, LS-174T, or RWP-1 cells, control or transfected with Snail1-HA cDNA (see the Materials and Methods). One-hundred-fifty micrograms of protein from total cell extracts were analyzed by Western blot using a mab specific to Zeb 2 protein. mRNA was isolated from the indicated cell lines and analyzed by qRT–PCR (C) or semiquantitative RT–PCR (D), with the oligonucleotides depicted in B. Oligos 3F–2R (C) corresponded to the translated sequence, 1F1R (D, bottom) flanked the intron present in the 5′-UTR, and 2F–1R (D, top), determined the conservation of the intron. The size of the DNA fragments amplified is indicated. The figure shows the result of one experiment out of three performed. In B, the ORF is depicted in black, the 5′-UTR and 3′-UTR exons are in gray, and the 5′-UTR intron is in white.
Figure 2.
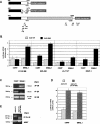
Zeb2 5′-UTR controls the expression of Luciferase. (A) Diagram of the constructions used in these assays. The sequence corresponding to the Zeb2 promoter (−842/+1) is indicated in black, the 5′-UTR intron (+410/+2928) is indicated in gray, and the rest of the 5′-UTR is indicated in white. The relative position of the oligonucleotides used in this figure is indicated. (B) Firefly Luciferase activity was determined after transfecting the constructions into the indicated cells. Firefly Luciferase was standardized to the value of Renilla Luciferase. (C) RNA was obtained from RWP-1 cells transfected with −842/+2998 construction in pGL3 plasmid. Splicing of exogenous intron was determined by semiquantitative RT–PCR with oligonucleotides specific to the intron and the exon. At this number of cycles, no amplified product was detected in mock-transfected cells. (D) Control or RWP1 cells stably expressing Snail1 cDNA were transfected with the indicated constructions and Firefly Luciferase activity was determined as described. (E) In parallel, RNA was obtained from the above-mentioned transfected RWP-1 cells and levels of exogenous transcript were determined with the indicated oligonuclotides. Results from B and D show the average ± SD of three experiments performed in triplicate.
Figure 3.
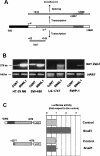
Zeb2 5′-UTR contains an IRES element. (A) Diagram of the bicistronic plasmids, pRF and pRF-L (promoterless), used in these assays. (B) RWP-1 cells were transfected with pRF plasmid containing the indicated inserts. Results were normalized according to Renilla Luciferase and referred to the value obtained with empty pRF vector. The figure shows the average ± SD of four experiments performed in triplicate. (C) pRF and pRF +2359/+2998 plasmids were transfected to RWP-1 cells; RNA was collected 2 d after transfection and analyzed by RT–PCR with the oligonucleotides indicated in the diagram, corresponding to Renilla Luciferase (top), Renilla Luciferase and +2359/+2998 insert (middle), or Renilla Luciferase and Firefly Luciferase (bottom). (D) RWP1- cells were transfected with pRF-L and pRF-L +2359/+2998 plasmids and pRF containing just Renilla Luciferase. Expression of Renilla Luciferase was dependent on the expression of this plasmid; no activity was detected with pRF-L plasmid. Activity of Firefly Luciferase was normalized according to Renilla Luciferase and represented in respect to the value obtained with empty pRF-L plasmid. The figure shows the average ± SD of three experiments performed in triplicate.
Figure 4.
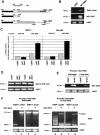
Zeb2 5′-UTR contains an IRES element. (A) A bicistronic RNA containing +2359/+2998 insert placed between Renilla and Firefly Luciferase was synthesized in vitro and capped as indicated in the Materials and Methods. This bicistronic RNA and a control without insert were transfected to RWP-1 cells ectopically expressing Snail1 (B), or to control RWP-1 cells (C). Renilla and Luciferase activities were determined after 12 h and referred to the value obtained for Renilla Luciferase in the transfection of capped RNA. The figure shows the average ± SD of three experiments performed in triplicate. (D) RNA was isolated from RWP-1 Snail1 cells transfected with the uncapped bicistronic transcripts 6 h after transfection, or from cells transfected with pRF-+2359/+2998 plasmid. Five micrograms of RNA were analyzed by Northern blot using a random prime [32P]-labeled probe corresponding to Firefly Luciferase coding region. Migration of the 28S and 18S ribosomal RNAs is indicated. The arrows indicate the migration of the transcripts corresponding to RLuc-+2359/+2998-FLuc and FLuc.
Figure 5.
Expression of a Zeb2 NAT is up-regulated in _Snail1_-transfected cells. (A) The diagram shows the sequence of NAT and the correspondence with sequences of the Zeb2 intron (shaded in gray) and the exon in 5′-UTR. The sequence within the intron corresponding to the IRES (+2357/2928) is shaded in dark gray. (B) RNA was purified from different cell lines stably transfected with control plasmids or Snail1-HA cDNA and analyzed by RT–PCR using oligonucleotides and conditions specific to Zeb2 5′-UTR NAT (see Materials and Methods). (C) The indicated fragments of the Zeb2 gene were inserted in the opposite orientation in pGL3 plasmid. The promoter activity of these DNA fragments was analyzed in RWP1 control or expressing Snail1. Values refer to that obtained with the longest fragment in RWP-1 Snail1 cells. The figure shows the average ± SD of three experiments performed in duplicate.
Figure 6.
Expression of Zeb2 NAT in epithelial cells prevents splicing of the 5′-UTR intron. (A) The different constructions used in this figure are shown, indicating also the relative position of the NAT. (B) Epithelial RWP-1 cells were transiently transfected with pcDNA3-Zeb2 NAT or pcDNA3 as control. RNA was collected and analyzed by RT–PCR with oligonucleotides specific for NAT, Zeb2 5′-UTR intron, or HPRT as control. (C) RWP-1 or SW-480 cells were cotransfected with pcDNA3 NAT, pGL3 (−842/+2998), or pGL3 (−842/+475) and Renilla Luciferase expression plasmid. Firefly Luciferase was determined and normalized according to the value of Renilla Luciferase. The values correspond to the average ± SD of stimulation observed in three experiments performed in these two cell lines. (D) Levels of transcript from transfected cells from C were analyzed by RT–PCR with two oligonuclotides corresponding to 5′-UTR exon. (E,F) pGL3 (−842/+2998) plasmid, either wild type or with a deletion comprising nucleotides 1920–2845, was transfected to RWP-1 control or Snail1-expressing cells. (E) Levels of NAT were determined as above by RT–PCR. At this number of cycles, RWP-1 Snail1 cells not transfected with pGL3 plasmids presented levels of NAT similar to those detected for pGL3 (−842/+2998)(Δ1920–2845). (F) Analysis of the splicing of the 5′-UTR intron in the exogenous RNA was carried out as above by RT–PCR with two oligonucleotides flanking this intron. When indicated, pcDNA3-Zeb2 NAT or pcDNA3 as control were cotransfected. In D and F, no amplified fragments corresponding to exon or intron sequences were detected at this number of cycles in mock-transfected cells.
Figure 7.
Stable expression of Zeb2 NAT in RWP1 or SW-480 cells up-regulates Zeb2 protein and down-regulates E-cadherin mRNA and protein. RWP-1 or SW-480 cell populations stably expressing Zeb2 NAT were obtained as indicated in the Materials and Methods. (A) Total protein extracts were prepared and analyzed by Western blot using antibodies specific to Zeb2, E-cadherin, or β-tubulin as loading control. (B) In parallel, RNA was purified and analyzed by qRT–PCR using oligonucleotides specific to Zeb2 RNA (ORF), E-cadherin (CDH1), or the mesenchymal markers fibronectin (FN1) and LEF-1. The values are represented as fold in respect to the value obtained in a cell population selected after transfecting the empty vector. The figure shows the average ± range of two analysis performed.
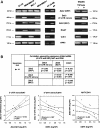
Figure 8.
Expression of Zeb2 NAT and 5′-UTR correlates closely in cell lines and human tumors. RNA was obtained from the indicated cell lines (A), treated with TGF-β (5 ng/mL) when appropriate, or from a panel of 14 colon adenocarcinomas (B). The expression of the different transcripts was performed by semiquantitative RT–PCR (A) or qRT–PCR (B) as indicated in the Materials and Methods. B, top, shows the Spearman coefficient and the P index corresponding to the association of expression of the different transcripts; the bottom shows the results corresponding to the most significant correlations, indicating the Pearson correlation coefficient.
Figure 9.
A model for the regulation of Zeb2 expression in epithelial and mesenchymal cells. (Left side, 1) In epithelial cells transcription of the main promoter of Zeb2 gene (in black) generates an RNA composed of a 3-kb 5′-UTR (in gray) and the ORF (in white). Upon binding of the spliceosome (2), an intron corresponding to 2.5 kb is eliminated, generating a processed transcript with a 5′-UTR of 481 nt (3). (4) This 5′-UTR contains a sequence that inhibits scanning by the ribosomes and therefore prevents translation of Zeb2 protein. (Right side, 5) After completion of the EMT, transcription of Zeb2 is accompanied by expression of a NAT depending on the activation of a different promoter placed 5′ downstream. Expression of this NAT is greater than the long transcript (not shown) and prevents binding of the spliceosome to the 5′ splice site (6) and, consequently, the intron present in the 5′-UTR is conserved (7). This intron contains an IRES situated close to the start of translation. Binding of the ribosomes to this IRES (8) makes the translation of Zeb2 protein possible (9).
Similar articles
- The miR-200 family and miR-205 regulate epithelial to mesenchymal transition by targeting ZEB1 and SIP1.
Gregory PA, Bert AG, Paterson EL, Barry SC, Tsykin A, Farshid G, Vadas MA, Khew-Goodall Y, Goodall GJ. Gregory PA, et al. Nat Cell Biol. 2008 May;10(5):593-601. doi: 10.1038/ncb1722. Epub 2008 Mar 30. Nat Cell Biol. 2008. PMID: 18376396 - The miR-200 family determines the epithelial phenotype of cancer cells by targeting the E-cadherin repressors ZEB1 and ZEB2.
Park SM, Gaur AB, Lengyel E, Peter ME. Park SM, et al. Genes Dev. 2008 Apr 1;22(7):894-907. doi: 10.1101/gad.1640608. Genes Dev. 2008. PMID: 18381893 Free PMC article. - Expression of E-cadherin repressors SNAIL, ZEB1 and ZEB2 by tumour and stromal cells influences tumour-budding phenotype and suggests heterogeneity of stromal cells in pancreatic cancer.
Galván JA, Zlobec I, Wartenberg M, Lugli A, Gloor B, Perren A, Karamitopoulou E. Galván JA, et al. Br J Cancer. 2015 Jun 9;112(12):1944-50. doi: 10.1038/bjc.2015.177. Epub 2015 May 19. Br J Cancer. 2015. PMID: 25989272 Free PMC article. Retracted. - Non-coding RNAs take centre stage in epithelial-to-mesenchymal transition.
Cano A, Nieto MA. Cano A, et al. Trends Cell Biol. 2008 Aug;18(8):357-9. doi: 10.1016/j.tcb.2008.05.005. Epub 2008 Jun 26. Trends Cell Biol. 2008. PMID: 18585040 Review. - Interactions between E-cadherin and microRNA deregulation in head and neck cancers: the potential interplay.
Wong TS, Gao W, Chan JY. Wong TS, et al. Biomed Res Int. 2014;2014:126038. doi: 10.1155/2014/126038. Epub 2014 Aug 4. Biomed Res Int. 2014. PMID: 25161999 Free PMC article. Review.
Cited by
- LncRNAs in the Type I Interferon Antiviral Response.
Suarez B, Prats-Mari L, Unfried JP, Fortes P. Suarez B, et al. Int J Mol Sci. 2020 Sep 3;21(17):6447. doi: 10.3390/ijms21176447. Int J Mol Sci. 2020. PMID: 32899429 Free PMC article. Review. - microRNA: The Impact on Cancer Stemness and Therapeutic Resistance.
Jiao X, Qian X, Wu L, Li B, Wang Y, Kong X, Xiong L. Jiao X, et al. Cells. 2019 Dec 18;9(1):8. doi: 10.3390/cells9010008. Cells. 2019. PMID: 31861404 Free PMC article. Review. - LncRNAs regulating stemness in aging.
Sousa-Franco A, Rebelo K, da Rocha ST, Bernardes de Jesus B. Sousa-Franco A, et al. Aging Cell. 2019 Feb;18(1):e12870. doi: 10.1111/acel.12870. Epub 2018 Nov 20. Aging Cell. 2019. PMID: 30456884 Free PMC article. Review. - Large non-coding RNAs: missing links in cancer?
Huarte M, Rinn JL. Huarte M, et al. Hum Mol Genet. 2010 Oct 15;19(R2):R152-61. doi: 10.1093/hmg/ddq353. Epub 2010 Aug 20. Hum Mol Genet. 2010. PMID: 20729297 Free PMC article. Review. - Hepatocyte-derived Snail1 propagates liver fibrosis progression.
Rowe RG, Lin Y, Shimizu-Hirota R, Hanada S, Neilson EG, Greenson JK, Weiss SJ. Rowe RG, et al. Mol Cell Biol. 2011 Jun;31(12):2392-403. doi: 10.1128/MCB.01218-10. Epub 2011 Apr 11. Mol Cell Biol. 2011. PMID: 21482667 Free PMC article.
References
- Barberà M.J., Puig I., Domínguez D., Julien-Grille S., Guaita-Esteruelas S., Peiro S., Baulida J., Francí C., Dedhar S., Larue L., et al. Regulation of Snail transcription during epithelial to mesenchymal transition of tumor cells. Oncogene. 2004;23:7345–7354. - PubMed
- Batlle E., Verdú J., Dominguez D., Llosas M.M., Díaz V., Loukiili N., Paciucci R., Alameda F., García de Herreros A. Protein kinase C-α activity differently modulates invasion and growth of intestinal cells. J. Biol. Chem. 1998;273:15091–15098. - PubMed
- Batlle E., Sancho E., Francí C., Domínguez D., Monfar M., Baulida J., García de Herreros A. The transcription factor Snail is a repressor of E-cadherin gene expression in epithelial tumor cells. Nat. Cell Biol. 2000;2:84–89. - PubMed
- Bindels S., Mestdagt M., Vanderwalle C., Jacobs N., Volders L., Noël A., van Roy F., Berx G., Foidart J.M., Gilles C. Regulation of vimentin by Sip1 in human epithelial breast tumor cells. Oncogene. 2006;25:4975–4985. - PubMed
- Brantl S. Antisense-RNA regulation and RNA interference. Biochim. Biophys. Acta. 2002;1575:15–25. - PubMed
Publication types
MeSH terms
Substances
LinkOut - more resources
Full Text Sources
Other Literature Sources
Research Materials
