Serial section scanning electron microscopy of adult brain tissue using focused ion beam milling - PubMed (original) (raw)
Serial section scanning electron microscopy of adult brain tissue using focused ion beam milling
Graham Knott et al. J Neurosci. 2008.
No abstract available
Figures
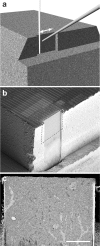
Figure 1.
a, Three-dimensional drawing of the resin block showing the arrangement of the gallium ion beam (white) that scans parallel to the block (indicated by double-headed arrow) and mills away a layer of resin, creating an imaging face. The electron imaging beam (gray) at an angle of 52° from this vertical face is then used to image the embedded tissue at this surface. b, Scanning electron micrograph of a tissue block in the same orientation as a with a dotted line indicating the milled region, which is shown in c in reverse contrast. Scale bar, 20 μm.
Figure 2.
a, Reverse-contrast backscattered electron micrograph of an imaging face milled to expose a field of view ∼120 × 115 μm. For this initial preparation phase, a small amount of “curtaining” can be seen in the bottom right corner. This imaging artifact can be removed once serial milling and imaging begins. The image was taken with a beam voltage of 5 keV, beam current of 0.40 nA, and pixel dwell time of 10 μs. The resolution of the image is 30 nm/pixel. Within this image, cell bodies (cb) and blood vessels (bv) are easily visible. b, Reverse-contrast backscattered scanning electron micrograph taken from the imaging face shown in a, of the neuronal cell body indicated as cb, using the same beam parameters, but a resolution of 10 nm/pixel. With these settings, the microscope can generate images that clearly show the stained membranes and many features within the neuropil, e.g., dendrites (de). c, The same image of the region enclosed in the white square in b, which has been enlarged to illustrate the detail that can be seen with these imaging parameters. The image shows an axonal bouton (ab) and dendritic spine head (sp). Scale bars: a, 20 μm; b, 5 μm.
Figure 3.
a, Reverse-contrast backscattered electron micrograph of a region of neuropil with a resolution of 4 nm/pixel. The electron beam energy was 5 keV. The image shows limited contrast between the stained membranes and intracellular space. This effect appears to blur the image. b, Reverse-contrast micrograph of the same region of the imaging face that was imaged in a. All the imaging parameters are the same, except that the electron beam energy has been lowered to 2 keV. In this image, the membrane contrast is improved and the depth of imaging is decreased. Arrows in both images indicate a myelinated axon. The inset images in both panels show a dendritic spine head (sp), but only in b can the cluster of vesicles be seen along with the presynaptic and postsynaptic densities (arrowheads).
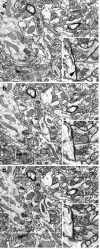
Figure 4.
a–c, Serial scanning electron micrographs taken from the imaging face each time that 40 nm of resin had been milled away. The beam voltage was 2 keV, the beam current was 0.4 nA, and the dwell time was 100 μs. The magnification was set at 4 nm/pixel, giving a field width of 8.4 μm. In each image, the inset shows a digitally magnified region that is indicated with the white square showing a bouton making an asymmetric synapase (white arrowhead) and a bouton making a symmetric synapse (black arrowhead). The dotted line in c indicates a portion of the field of view that was selected from the stack of 120 images that is shown in supplemental movie 1 (available at
as supplemental material).
Similar articles
- Gas cluster ion beam SEM for imaging of large tissue samples with 10 nm isotropic resolution.
Hayworth KJ, Peale D, Januszewski M, Knott GW, Lu Z, Xu CS, Hess HF. Hayworth KJ, et al. Nat Methods. 2020 Jan;17(1):68-71. doi: 10.1038/s41592-019-0641-2. Epub 2019 Nov 18. Nat Methods. 2020. PMID: 31740820 - Coupled Broad Ion Beam-Scanning Electron Microscopy (BIB-SEM) for polishing and three dimensional (3D) serial section tomography (SST).
Gholinia A, Curd ME, Bousser E, Taylor K, Hosman T, Coyle S, Shearer MH, Hunt J, Withers PJ. Gholinia A, et al. Ultramicroscopy. 2020 Jul;214:112989. doi: 10.1016/j.ultramic.2020.112989. Epub 2020 Apr 24. Ultramicroscopy. 2020. PMID: 32416435 - Combining serial block face and focused ion beam scanning electron microscopy for 3D studies of rare events.
Guérin CJ, Kremer A, Borghgraef P, Shih AY, Lippens S. Guérin CJ, et al. Methods Cell Biol. 2019;152:87-101. doi: 10.1016/bs.mcb.2019.03.014. Epub 2019 May 7. Methods Cell Biol. 2019. PMID: 31326028 - New developments in electron microscopy for serial image acquisition of neuronal profiles.
Kubota Y. Kubota Y. Microscopy (Oxf). 2015 Feb;64(1):27-36. doi: 10.1093/jmicro/dfu111. Epub 2015 Jan 5. Microscopy (Oxf). 2015. PMID: 25564566 Review. - Volume scanning electron microscopy for imaging biological ultrastructure.
Titze B, Genoud C. Titze B, et al. Biol Cell. 2016 Nov;108(11):307-323. doi: 10.1111/boc.201600024. Epub 2016 Aug 12. Biol Cell. 2016. PMID: 27432264 Review.
Cited by
- Large-scale 3D imaging of mouse cochlea using serial block-face scanning electron microscopy.
Lu Y, Wang F, Wang H, Bastians P, Hua Y. Lu Y, et al. STAR Protoc. 2021 May 4;2(2):100515. doi: 10.1016/j.xpro.2021.100515. eCollection 2021 Jun 18. STAR Protoc. 2021. PMID: 34027478 Free PMC article. - Clustered structural and functional plasticity of dendritic spines.
Lu J, Zuo Y. Lu J, et al. Brain Res Bull. 2017 Mar;129:18-22. doi: 10.1016/j.brainresbull.2016.09.008. Epub 2016 Sep 13. Brain Res Bull. 2017. PMID: 27637453 Free PMC article. Review. - Building retinal connectomes.
Marc RE, Jones BW, Lauritzen JS, Watt CB, Anderson JR. Marc RE, et al. Curr Opin Neurobiol. 2012 Aug;22(4):568-74. doi: 10.1016/j.conb.2012.03.011. Epub 2012 Apr 11. Curr Opin Neurobiol. 2012. PMID: 22498714 Free PMC article. Review. - Large-scale automatic reconstruction of neuronal processes from electron microscopy images.
Kaynig V, Vazquez-Reina A, Knowles-Barley S, Roberts M, Jones TR, Kasthuri N, Miller E, Lichtman J, Pfister H. Kaynig V, et al. Med Image Anal. 2015 May;22(1):77-88. doi: 10.1016/j.media.2015.02.001. Epub 2015 Mar 2. Med Image Anal. 2015. PMID: 25791436 Free PMC article. - Using transmission electron microscopy and 3View to determine collagen fibril size and three-dimensional organization.
Starborg T, Kalson NS, Lu Y, Mironov A, Cootes TF, Holmes DF, Kadler KE. Starborg T, et al. Nat Protoc. 2013;8(7):1433-48. doi: 10.1038/nprot.2013.086. Epub 2013 Jun 27. Nat Protoc. 2013. PMID: 23807286 Free PMC article.
References
- Anderson JC, Douglas RJ, Martin KA, Nelson JC. Map of the synapses formed with the dendrites of spiny stellate neurons of cat visual cortex. J Comp Neurol. 1994;341:25–38. - PubMed
- Fiala JC, Harris KM. Cylindrical diameters method for calibrating section thickness in serial electron microscopy. J Microsc. 2001;202:468–472. - PubMed
Publication types
MeSH terms
Substances
LinkOut - more resources
Full Text Sources
Other Literature Sources


