Liver-specific deletion of histone deacetylase 3 disrupts metabolic transcriptional networks - PubMed (original) (raw)
Liver-specific deletion of histone deacetylase 3 disrupts metabolic transcriptional networks
Sarah K Knutson et al. EMBO J. 2008.
Abstract
Histone deacetylase 3 (Hdac3) is an enzymatic component of transcriptional repression complexes recruited by the nuclear hormone receptors. Inactivation of Hdac3 in cancer cell lines triggered apoptosis, and removal of Hdac3 in the germ line of mice caused embryonic lethality. Therefore, we deleted Hdac3 in the postnatal mouse liver. These mice developed hepatomegaly, which was the result of hepatocyte hypertrophy, and these morphological changes coincided with significant imbalances between carbohydrate and lipid metabolism. Loss of Hdac3 triggered changes in gene expression consistent with inactivation of repression mediated by nuclear hormone receptors. Loss of Hdac3 also increased the levels of Ppar gamma2, and treatment of these mice with a Ppar gamma antagonist partially reversed the lipid accumulation in the liver. In addition, gene expression analysis identified mammalian target of rapamycin signalling as being activated after deletion of Hdac3, and inhibition by rapamycin affected the accumulation of neutral lipids in Hdac3-null livers. Thus, Hdac3 regulates metabolism through multiple signalling pathways in the liver, and deletion of Hdac3 disrupts normal metabolic homeostasis.
Figures
Figure 1
Inducible deletion of Hdac3 using Mx1-Cre. (A) RT–PCR was used to detect Hdac3 mRNA levels in whole-liver extracts and (B) western blot analysis detected Hdac3 protein in whole-cell lysates of livers from mice of the indicated genotypes 2 days after the final injection of pIpC. (C) Gross morphology (left-hand panels) of control and _Hdac3_-null livers at 2 days and 3 weeks after pIpC injection. The right-hand panels show H&E-stained sections ( × 400) from the livers shown in the left-hand panels.
Figure 2
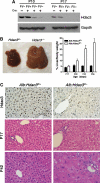
Constitutive deletion of Hdac3 using liver-specific Alb-Cre. (A) Hdac3 western blot analysis of liver extracts of 10- or 17-day-old mice of the indicated genotypes. (B) Deletion of Hdac3 results in liver hypertrophy over time. Representative photographs of P42 control and _Hdac3_-null livers are shown. The graph depicts the ratio of liver weight to gross animal weight between 17 and 56 days of age (P17, _P_=0.0001; P28, _P_=0.0001; P42, _P_=0.0013; P56, _P_=0.0001). Statistics were generated using the Student's _t_-test. (C) Immunohistochemistry for Hdac3 in P28 liver tissue ( × 200) is shown in the upper panels, and histological analysis using H&E-stained sections ( × 400) of _Hdac3_-null livers isolated from mice of the indicated ages is shown in the lower panels. Littermate controls are depicted in the left-hand panels.
Figure 3
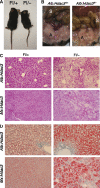
Loss of Hdac3 significantly alters metabolism. (A) Alb:Hdac3 fl/− mice are smaller than littermate controls, starting at 4 weeks of age. Control animal is depicted to the left in the photo. (B) Representation of the decrease in visceral adipose tissue in 15-week-old female Alb:Hdac3 fl/− mice (right panel). S, small intestine; A, visceral adipose tissue. Note that the liver in the Alb:Hdac3 fl/− mouse extends into the photo whereas the normal-sized liver in the wild type is not visible in this frame. (C) Decrease in glycogen as detected by PAS stain and (D) accumulation of lipid droplets as detected by Oil Red O stain of Alb:Hdac3 fl/− (P17) and Mx:Hdac3 fl/− (2 weeks after final pIpC injection) livers ( × 100). Littermate controls are shown in the left-hand panels.
Figure 4
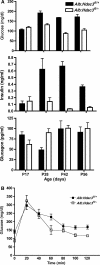
Alb:Hdac3 fl/− mice are hypoglycaemic and are insulin sensitive. (A) Graphical representation of whole-blood measurements of glucose (P17, _P_=0.065; P28, _P_=0.0001; P42, _P_=0.0002; P56, _P_=0.0006) and the serum levels of insulin (P17, _P_=0.63; P28, _P_=0.02; P42, _P_=0.0001; P56, _P_=0.0001) and glucagon (P17, _P_=0.062; P28, _P_=0.021; P42, _P_=0.9; P56, _P_=0.66) at the indicated time points in Alb:Hdac3 mice. (B) The glucose tolerance test was performed in 10-week-old Alb:Hdac3 mice, which were fasted for 6 h before a dose of 1.5 mg/g glucose. Glucose levels were measured at the indicated time points over a 2-h period. (0′, _P_=0.0012; 20′, _P_=0.54; 40′, _P_=0.78; 60′, _P_=0.054; 80′, _P_=0.14; 100′, _P_=0.013; 120′, _P_=0.0082). Statistics were generated using the Student's _t_-test.
Figure 5
Histone acetylation increases in Alb:Hdac3 fl/− mice. (A) Analysis of histone modifications in P17 liver nuclear lysates with the specified genotypes using the indicated antibodies. (B) ChIP of promoters in livers of genes identified as upregulated through microarray analysis and non-transcriptionally activated sequences using antibodies to the indicated acetylated histone residues. Exon5 refers to sequences in exon 5 of Cyp51. Data are shown relative to the levels of histone H3, and the increase in Alb:Hdac3 fl/− mice over controls is denoted by the dashed line.
Figure 6
Pparγ is upregulated in the absence of Hdac3. (A) Detection of Ppar isoforms (_Ppar_α, _Ppar_β, and _Ppar_γ) in P17 _Hdac3_-null livers by Q-RT–PCR, and western blot analysis of Pparγ in liver whole-cell lysates at P28. Heterozygous littermates were used as controls. (B) Differential regulation of the two different isoforms of _Ppar_γ in 17-day Alb:Hdac3 mice is shown in the left-hand panel. Q-RT–PCR of Ppar_γ_1 and Ppar_γ_2 levels in Alb:Hdac3 fl/− mice at the indicated time points is shown in the right-hand panel. (C) Q-RT–PCR of the Pparγ target genes, Cd36 and Pdk4, in Alb:Hdac3 fl/− vehicle- and GW9662-treated mice (_P_=0.029 and _P_=0.208, respectively, Student's _t_-test). (D) Cohorts of Alb:Hdac3 mice were treated with vehicle or GW9662, an inhibitor of Pparγ, for 4 weeks and liver tissue was stained with Oil-Red O to detect lipid. The upper panels depict control mice ( × 400 magnification) and middle ( × 100 magnification) and lower panels ( × 400 magnification) depict Alb:Hdac3 fl/− mice.
Figure 7
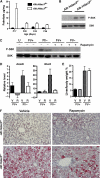
Loss of Hdac3 activates mTOR, which contributes to disrupted metabolism. (A) Palmitate levels in Hdac3:Alb mice at P17–P56. (B) Western blot analysis of P28 liver whole-cell lysates indicating levels of S6K and phosphorylated S6K (P-S6K). (C) Cohorts of Alb:Hdac3 fl/+ and Alb:Hdac3 fl/− mice were treated with vehicle or rapamycin for 3 weeks, and a representative western blot analysis of S6K and P-S6K indicates inhibition of mTOR after rapamycin treatment. (D) Q-RT–PCR of known mRNAs regulated by mTOR in the indicated groups of mice (Acacb, _P_=0.151, and Glut4, _P_=0.015, using Student's _t_-test). V, vehicle treated; R, rapamycin treated. (E) Graphical representation of liver weight/body weight ratio of vehicle-treated, or rapamycin-treated Alb:Hdac3 mice. V, vehicle treated; R, rapamycin treated. (F) Oil-Red O staining of liver tissue from the indicated genotypes, treated with vehicle or rapamycin. The upper panels depict control livers, whereas the lower panels depict _Hdac3_-null livers ( × 200 magnification).
Similar articles
- Deacetylase-independent function of HDAC3 in transcription and metabolism requires nuclear receptor corepressor.
Sun Z, Feng D, Fang B, Mullican SE, You SH, Lim HW, Everett LJ, Nabel CS, Li Y, Selvakumaran V, Won KJ, Lazar MA. Sun Z, et al. Mol Cell. 2013 Dec 26;52(6):769-82. doi: 10.1016/j.molcel.2013.10.022. Epub 2013 Nov 21. Mol Cell. 2013. PMID: 24268577 Free PMC article. - High expression of liver histone deacetylase 3 contributes to high-fat-diet-induced metabolic syndrome by suppressing the PPAR-γ and LXR-α-pathways in E3 rats.
Li D, Wang X, Ren W, Ren J, Lan X, Wang F, Li H, Zhang F, Han Y, Song T, Holmdahl R, Lu S. Li D, et al. Mol Cell Endocrinol. 2011 Sep 15;344(1-2):69-80. doi: 10.1016/j.mce.2011.06.028. Epub 2011 Jul 8. Mol Cell Endocrinol. 2011. PMID: 21763752 - Inhibition of HDAC3 promotes ligand-independent PPARγ activation by protein acetylation.
Jiang X, Ye X, Guo W, Lu H, Gao Z. Jiang X, et al. J Mol Endocrinol. 2014 Oct;53(2):191-200. doi: 10.1530/JME-14-0066. Epub 2014 Jun 30. J Mol Endocrinol. 2014. PMID: 24982244 Free PMC article. - HDAC3: taking the SMRT-N-CoRrect road to repression.
Karagianni P, Wong J. Karagianni P, et al. Oncogene. 2007 Aug 13;26(37):5439-49. doi: 10.1038/sj.onc.1210612. Oncogene. 2007. PMID: 17694085 Review. - The critical roles of histone deacetylase 3 in the pathogenesis of solid organ injury.
Ning L, Rui X, Bo W, Qing G. Ning L, et al. Cell Death Dis. 2021 Jul 23;12(8):734. doi: 10.1038/s41419-021-04019-6. Cell Death Dis. 2021. PMID: 34301918 Free PMC article. Review.
Cited by
- Histone deacetylase 3 is an epigenomic brake in macrophage alternative activation.
Mullican SE, Gaddis CA, Alenghat T, Nair MG, Giacomin PR, Everett LJ, Feng D, Steger DJ, Schug J, Artis D, Lazar MA. Mullican SE, et al. Genes Dev. 2011 Dec 1;25(23):2480-8. doi: 10.1101/gad.175950.111. Genes Dev. 2011. PMID: 22156208 Free PMC article. - Histone Deacetylase 3 Is Required for T Cell Maturation.
Hsu FC, Belmonte PJ, Constans MM, Chen MW, McWilliams DC, Hiebert SW, Shapiro VS. Hsu FC, et al. J Immunol. 2015 Aug 15;195(4):1578-90. doi: 10.4049/jimmunol.1500435. Epub 2015 Jul 10. J Immunol. 2015. PMID: 26163592 Free PMC article. - Synergistic Enhancement of Cancer Therapy Using HDAC Inhibitors: Opportunity for Clinical Trials.
Hontecillas-Prieto L, Flores-Campos R, Silver A, de Álava E, Hajji N, García-Domínguez DJ. Hontecillas-Prieto L, et al. Front Genet. 2020 Sep 11;11:578011. doi: 10.3389/fgene.2020.578011. eCollection 2020. Front Genet. 2020. PMID: 33024443 Free PMC article. Review. - Molecular Mechanisms and Genome-Wide Aspects of PPAR Subtype Specific Transactivation.
Bugge A, Mandrup S. Bugge A, et al. PPAR Res. 2010;2010:169506. doi: 10.1155/2010/169506. Epub 2010 Aug 31. PPAR Res. 2010. PMID: 20862367 Free PMC article. - The role of altered protein acetylation in neurodegenerative disease.
Kabir F, Atkinson R, Cook AL, Phipps AJ, King AE. Kabir F, et al. Front Aging Neurosci. 2023 Jan 4;14:1025473. doi: 10.3389/fnagi.2022.1025473. eCollection 2022. Front Aging Neurosci. 2023. PMID: 36688174 Free PMC article. Review.
References
- Brown NF, Stefanovic-Racic M, Sipula IJ, Perdomo G (2007) The mammalian target of rapamycin regulates lipid metabolism in primary cultures of rat hepatocytes. Metabolism 56: 1500–1507 - PubMed
Publication types
MeSH terms
Substances
Grants and funding
- R01 CA077274/CA/NCI NIH HHS/United States
- T32 CA009582/CA/NCI NIH HHS/United States
- R01-CA77274/CA/NCI NIH HHS/United States
- P30 DK058404/DK/NIDDK NIH HHS/United States
- P30 CA068485/CA/NCI NIH HHS/United States
- CA68485/CA/NCI NIH HHS/United States
- R01-CA64140/CA/NCI NIH HHS/United States
- R01 CA064140/CA/NCI NIH HHS/United States
- T32 CA009385/CA/NCI NIH HHS/United States
- 5P30DK58404/DK/NIDDK NIH HHS/United States
LinkOut - more resources
Full Text Sources
Other Literature Sources
Molecular Biology Databases


