Whole genome-amplified DNA: insights and imputation - PubMed (original) (raw)
doi: 10.1038/nmeth0408-279.
Michael Inouye, Kerrin S Small, Andrew E Fry, Simon C Potter, Sarah J Dunstan, Mark Seielstad, Inês Barroso, Nicholas J Wareham, Kirk A Rockett, Dominic P Kwiatkowski, Panos Deloukas
- PMID: 18376389
- PMCID: PMC2683750
- DOI: 10.1038/nmeth0408-279
Whole genome-amplified DNA: insights and imputation
Yik Y Teo et al. Nat Methods. 2008 Apr.
No abstract available
Figures
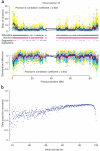
Figure 1
Missingness and imputation of amplified DNA on chromosome 16. (a) The relative performance of amplified DNA to genomic DNA, as quantified by the ratio of hybridization strengths and the standardized difference in mean hybridization strength. Each plot shows data from three comparisons of amplified DNA to genomic DNA. Affymetrix: TB (cyan dots and blue lines); Affymetrix: OBC-58C (gray dots and red lines); Illumina: ML-58C (yellow dots and black lines). Lines below the upper plots indicate regions where SNPs on the platform have call rates < 95.0%. The dashes in black indicate regions of segmental duplications. (b) The expected proportion of missing genotypes which can be recovered using the program IMPUTE6 as a function of the initial call rate. Initial SNP call rates have been partitioned into 0.01 bins with each bin’s data proportion recovery averaged across the number of SNPs.
Similar articles
- High fidelity of whole-genome amplified DNA on high-density single nucleotide polymorphism arrays.
Xing J, Watkins WS, Zhang Y, Witherspoon DJ, Jorde LB. Xing J, et al. Genomics. 2008 Dec;92(6):452-6. doi: 10.1016/j.ygeno.2008.08.007. Epub 2008 Sep 27. Genomics. 2008. PMID: 18786630 Free PMC article. - Genome-wide single-nucleotide polymorphism arrays demonstrate high fidelity of multiple displacement-based whole-genome amplification.
Tzvetkov MV, Becker C, Kulle B, Nürnberg P, Brockmöller J, Wojnowski L. Tzvetkov MV, et al. Electrophoresis. 2005 Feb;26(3):710-5. doi: 10.1002/elps.200410121. Electrophoresis. 2005. PMID: 15690424 - Allelic imbalance analysis by high-density single-nucleotide polymorphic allele (SNP) array with whole genome amplified DNA.
Wong KK, Tsang YT, Shen J, Cheng RS, Chang YM, Man TK, Lau CC. Wong KK, et al. Nucleic Acids Res. 2004 May 17;32(9):e69. doi: 10.1093/nar/gnh072. Nucleic Acids Res. 2004. PMID: 15148342 Free PMC article. - Cell sampling and global nucleic acid amplification.
Nygaard V, Hovig E. Nygaard V, et al. SEB Exp Biol Ser. 2008;61:17-36. SEB Exp Biol Ser. 2008. PMID: 18709735 Review. No abstract available. - Quantitative trait loci for IQ and other complex traits: single-nucleotide polymorphism genotyping using pooled DNA and microarrays.
Craig I, Plomin R. Craig I, et al. Genes Brain Behav. 2006;5 Suppl 1:32-7. doi: 10.1111/j.1601-183X.2006.00192.x. Genes Brain Behav. 2006. PMID: 16417615 Review.
Cited by
- Perturbation analysis: a simple method for filtering SNPs with erroneous genotyping in genome-wide association studies.
Teo YY, Small KS, Clark TG, Kwiatkowski DP. Teo YY, et al. Ann Hum Genet. 2008 May;72(Pt 3):368-74. doi: 10.1111/j.1469-1809.2007.00422.x. Epub 2008 Feb 6. Ann Hum Genet. 2008. PMID: 18261185 Free PMC article. - High fidelity of whole-genome amplified DNA on high-density single nucleotide polymorphism arrays.
Xing J, Watkins WS, Zhang Y, Witherspoon DJ, Jorde LB. Xing J, et al. Genomics. 2008 Dec;92(6):452-6. doi: 10.1016/j.ygeno.2008.08.007. Epub 2008 Sep 27. Genomics. 2008. PMID: 18786630 Free PMC article. - Evaluation of genome coverage and fidelity of multiple displacement amplification from single cells by SNP array.
Ling J, Zhuang G, Tazon-Vega B, Zhang C, Cao B, Rosenwaks Z, Xu K. Ling J, et al. Mol Hum Reprod. 2009 Nov;15(11):739-47. doi: 10.1093/molehr/gap066. Epub 2009 Aug 11. Mol Hum Reprod. 2009. PMID: 19671595 Free PMC article. - Host genetic and epigenetic factors in toxoplasmosis.
Jamieson SE, Cordell H, Petersen E, McLeod R, Gilbert RE, Blackwell JM. Jamieson SE, et al. Mem Inst Oswaldo Cruz. 2009 Mar;104(2):162-9. doi: 10.1590/s0074-02762009000200006. Mem Inst Oswaldo Cruz. 2009. PMID: 19430638 Free PMC article. - A global network for investigating the genomic epidemiology of malaria.
Malaria Genomic Epidemiology Network. Malaria Genomic Epidemiology Network. Nature. 2008 Dec 11;456(7223):732-7. doi: 10.1038/nature07632. Nature. 2008. PMID: 19079050 Free PMC article.
References
- Marchini J, Howie B, Myers S, McVean G, Donnelly P. Nat. Genet. 2007;39:906–913. - PubMed
Publication types
MeSH terms
Substances
Grants and funding
- G0600230/MRC_/Medical Research Council/United Kingdom
- 077011/WT_/Wellcome Trust/United Kingdom
- 077016/WT_/Wellcome Trust/United Kingdom
- MC_U106179471/MRC_/Medical Research Council/United Kingdom
- G19/9/MRC_/Medical Research Council/United Kingdom
LinkOut - more resources
Full Text Sources
