Mitogen- and stress-activated kinase 1-mediated histone H3 phosphorylation is crucial for cell transformation - PubMed (original) (raw)
Mitogen- and stress-activated kinase 1-mediated histone H3 phosphorylation is crucial for cell transformation
Hong-Gyum Kim et al. Cancer Res. 2008.
Abstract
Mitogen- and stress-activated kinase 1 (MSK1) belongs to a family of dual protein kinases that are activated by either extracellular signal-regulated kinase or p38 mitogen-activated protein kinases in response to stress or mitogenic extracellular stimuli. The physiologic role of MSK1 in malignant transformation and cancer development is not well understood. Here, we report that MSK1 is involved in 12-O-tetradecanoylphorbol-13-acetate (TPA)-induced or epidermal growth factor (EGF)-induced neoplastic transformation of JB6 Cl41 cells. H89, a potent inhibitor of MSK1, strongly suppressed TPA-induced or EGF-induced cell transformation. When cells overexpressing wild-type MSK1 were treated with TPA or EGF, colony formation increased substantially compared with untreated cells or cells that did not overexpress MSK1. In contrast, MSK1 COOH terminal or NH(2) terminal dead dominant negative mutants dramatically suppressed cell transformation. Introduction of small interfering RNA-MSK1 into JB6 Cl41 cells resulted in suppressed TPA-induced or EGF-induced cell transformation. In addition, cell proliferation was inhibited in MSK1 knockdown cells compared with MSK1 wild-type cells. In wild-type MSK1-overexpressing cells, activator protein (AP-1) activation increased after TPA or EGF stimulation, whereas AP-1 activation decreased in both MSK1 dominant-negative mutants and in MSK1 knockdown cells. Moreover, TPA-induced or EGF-induced phosphorylation of histone H3 at Ser(10) was increased in wild-type cells but the induced phosphorylation was abolished in MSK1 dominant-negative mutant or MSK1 knockdown cells. Thus, MSK1 is required for tumor promoter-induced cell transformation through its phosphorylation of histone H3 at Ser(10) and AP-1 activation.
Figures
Figure 1
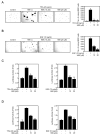
TPA or EGF induces cell transformation and MSK1 phosphorylation in JB6 Cl41 mouse epidermal skin cells. (A and B) JB6 Cl41 cells were assessed for cell transformation in an anchorage-independent soft agar assay in the presence of TPA (A) or EGF (B). Cells (8 × 10³/mL) were exposed to TPA (0, 0.5, 5, or 20 ng/mL) or EGF (0, 0.1, 1, or 10 ng/mL) in 1 mL of 0.3% Basal Medium Eagle (BME) agar containing 10% FBS. The cultures were maintained at 37°C in a 5% CO2 atmosphere for 10-12 days and then colonies were counted using a microscope and the Image-Pro PLUS (v.4) computer software program. The average colony number was calculated (right panels); plates were photographed (left panels) from three separate experiments (A and B) and representative plates are shown. Significant differences were evaluated using the Student's t test and the respective asterisks indicate a significant increase in TPA- or EGF-induced cell transformation (*, p < 0.001 and **, p < 0.0001) compared to untreated control. (C and D) JB6 Cl41 cells were used to determine the protein levels of endogenous phosphorylated MSK1 in TPA- or EGF-induced cell transformation. Cells (2 × 10⁵/mL) were starved in 0.1% FBS-MEM for 24 hours at 37°C in a 5% CO2 atmosphere and then stimulated with 20 ng/mL of TPA (C) or 10 ng/mL of EGF (D) and finally harvested at various time periods. Cells were disrupted and proteins extracted with NP-40 cell lysis buffer and Western blotting was conducted as described the Materials and Methods using specific antibodies as indicated. β-Actin was used to confirm equal protein loading.
Figure 2
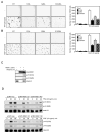
H89, a potent inhibitor of MSK1, strongly inhibits colony formation and AP-1 activation induced by TPA or EGF. (A and B) H89 suppresses TPA- or EGF-induced anchorage-independent colony formation in soft agar. Cells (8 × 10³/mL) were exposed to TPA (20 ng/mL, A) or EGF (10 ng/mL, B) and different doses of H89 in 1 mL of 0.3% BME agar containing 10% FBS. The cultures were maintained at 37°C in a 5% CO2 atmosphere for 10-12 days and then colonies were counted using a microscope and the Image-Pro PLUS (v.4) computer software program. The average colony number was calculated (right panels) and plates were photographed (left panels) from three separate experiments (A and B) and representative plates are shown. Significant differences were evaluated using the Student's t-test and the respective asterisks indicate a significant decrease in TPA- or EGF-induced cell transformation by H89 compared with cells treated with only TPA or EGF (*, p < 0.005 and **, p < 0.0001). C, JB6 Cl41 cells were cotransfected with a plasmid mixture containing the AP-1-luciferase reporter gene (0.25 μg) and with the pCMV-β-Gal gene (0.05 μg) for normalization. At 36 h after transfection, cells were starved for 24 h by incubating in serum-deprived MEM at 37°C in a 5% CO2 atmosphere and then pretreated for 30 min with different doses of H89, followed by stimulation with 20 ng/mL of TPA (left panel) or 10 ng/mL of EGF (right panel) for an additional 12 h and then harvested. D, JB6 Cl41 cells were cotransfected with a plasmid mixture containing the c-fos-luciferase reporter gene (0.1 μg) and the pCMV-β-Gal gene (0.05 μg) for normalization purposes. At 36 h after transfection, cells were starved for 24 h by incubating in serum-deprived MEM at 37°C in a 5% CO2 atmosphere and then pretreated for 30 min with different doses of H89 followed by stimulation with 20 ng/mL of TPA (left panel) or 10 ng/mL of EGF (right panel) followed by harvesting after 12 h. The firefly luciferase activity was determined in cell lysates and normalized against β-galactosidase activity. Significant differences were evaluated using the Student's t-test and the respective asterisks indicate a significant decrease in TPA- or EGF-induced AP-1 activation by H89 compared with cells treated with only TPA or EGF (*, p < 0.01, **, p < 0.005 and ***, p < 0.0001).
Figure 3
MSK1 dominant-negative mutants suppress cell transformation and AP-1 activation promoted by TPA or EGF. (A and B) Cells (8 × 10³/mL) transfected with pCMV-neo, pCMV-MSK1 WT, pCMV-MSK1 CD, or pCMV-MSK1 ND were subjected to a soft agar assay in the presence of TPA (20 ng/mL, A) or EGF (10 ng/mL, B) in 1 mL of 0.3% BME agar containing 10% FBS. The cultures were maintained at 37°C in a 5% CO2 atmosphere for 10-12 days and then colonies were counted using a microscope and the Image-Pro PLUS (v.4) computer software program. The average colony number was calculated (right panels) and photographed (left panels) from three separate experiments (A and B, right). Representative plates are shown. Significant differences were evaluated using the Student's t test and the respective asterisks indicate a significant decrease in TPA- or EGF-induced cell transformation compared to cells treated with only TPA or EGF (*, p < 0.005, **, p < 0.0005 and ***, p < 0.0001). (C and D) JB6 Cl41 cells were transfected with a plasmid mixture containing the AP-1-luciferase reporter gene (0.5 μg) or with the pCMV-β-Gal gene (0.1 μg) for normalization. At 36 h after transfection, cells were starved for 24 h by incubating in serum-deprived MEM at 37°C in a 5% CO2 atmosphere and then incubated with 20 ng/mL of TPA (C) or 10 ng/mL of EGF (D) for 12 h. The firefly luciferase activity was determined in cell lysates and normalized against β-galactosidase activity. Significant differences were evaluated using the Student's t test and the respective asterisks indicate a significant decrease in TPA- or EGF-induced AP-1 activation compared to cells treated with only TPA or EGF (*, p < 0.005, **, p < 0.0005 and ***, p < 0.0001).
Figure 4
MSK1-mediated phosphorylation of histone H3 at Ser10 regulates TPA- or EGF-induced cell transformation. (A and B) Cells (8 × 10³/mL) transfected with histone H3 WT or mutants, S10A, S28A or S10/28A, were subjected to a soft agar assay in presence of TPA (20 ng/mL, A) or EGF (10 ng/mL, B) in 1 mL of 0.3% BME agar containing 10% FBS. The cultures were maintained at 37°C in a 5% CO2 atmosphere for 10-12 days and then colonies were counted using a microscope and the Image-Pro PLUS (v.4) computer software program. The average colony number was calculated (right panels) and photographed (left panels) from three separate experiments (A and B) and representative plates are shown. Significant differences were evaluated using the Student's t test and the respective asterisks indicate a significant decrease in TPA- or EGF-induced cell transformation compared to overexpressed histone H3 WT cells (*, p < 0.005 and **, p < 0.0001). C, MSK1 phosphorylates histone H3 at Ser10 or Ser28. Active MSK1 (50 ng) was combined with human histone H3 (1 μg) protein and 50 μM ATP. The reaction was carried out at 30°C for 30 min and then stopped by adding 6X SDS-sample buffer. The samples were resolved by 15% SDS-PAGE and the protein bands were visualized by Western blotting with specific antibodies to detect total MSK1 or phosphorylation of histone H3 at Ser10 or Ser28. D, cells transfected with pCMV-neo, pCMV-MSK1 CD, or pCMV-MSK1 ND were analyzed to detect endogenous phosphorylated histone H3 levels induced by TPA or EGF. Cells (6 × 10⁵/mL) were starved in 0.1% FBS-MEM for 24 h at 37°C in a 5% CO2 atmosphere and then stimulated with 20 ng/mL of TPA (upper panels) or 10 ng/mL of EGF (bottom panels) for various periods of time. Histone proteins (1 μg) were resolved by SDS-15% polyacrylamide gel electrophoresis and then transferred to membranes for Western blot analysis. The phosphorylation of histone H3 at Ser10 or Ser28 was detected with specific antibodies. Detection of total histone H3 was used for confirming equal loading of protein.
Figure 5
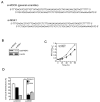
Knockdown of MSK1 suppresses cell proliferation. A, DNA sequence of the si-MOCK and si-MSK1 primers. B, si-MSK1 efficiently suppresses the endogenous MSK1 protein level. JB6 Cl41 cells were cotransfected with pcDNA3.1-neo and pU6pro control or the si-MSK1 gene, selected with 400 μg/mL G418 for 12 days, and then pooled. The expression of MSK1 was analyzed in the stable transfectant JB6 Cl41 cells. The lysates were resolved by 10% SDS-PAGE and the protein bands were visualized by Western blotting with a specific MSK1 primary antibody and an HRP-conjugated secondary antibody. Detection of total β-actin was used to verify equal loading of protein. C, cells stably transfected with the si-MOCK or si-MSK1 plasmid were seeded (1 × 10³/well) in 96-well plates in 100 μL of 5% FBS-MEM, and cell proliferation was estimated using the CellTiter 96 Aqueous One Solution detection kit (Promega). Cell proliferation was estimated by absorbance at 492 nm at 24-h intervals up to 96 h. Data are presented as means ± S.D. of triplicate experiments. Statistical differences were evaluated using the Student's _t_-test and the respective asterisks indicate a significant change in si-MSK1 cells compared to si-MOCK control cells (*, p < 0.001 and **, p < 0.0001). D, si-MOCK or si-MSK1 stably expressing (2 × 10⁵/mL) cells were seeded into 60-mm dishes and cultured 24 h. The cells were harvested, fixed with methanol, stained with propidium iodide (PI), and then analyzed for cell cycle phase. Data are expressed as the percentage of cells in G1/G0, S or G2/M phase and are represented as the mean ± S.D. of values obtained from triplicate experiments. Statistical differences were evaluated using the Student's _t_-test and the respective asterisks indicate a significant change in cell cycle phase distribution in si-MSK1 cells compared to si-MOCK control cells (*, p < 0.01 and **, p < 0.0001).
Figure 6
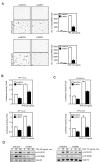
Knockdown of MSK1 suppresses TPA- or EGF-induced cell transformation and phosphorylation of histone H3. A, si-MOCK and si-MSK1 stably transfected cells (8 × 10³/mL) were exposed to TPA (20 ng/mL, upper panels) or EGF (10 ng/mL, bottom panels) in 1 mL of 0.3% BME agar containing 10% FBS. The cultures were maintained at 37°C in a 5% CO2 atmosphere for 10-12 days and then colonies were counted using a microscope and the Image-Pro PLUS (v.4) computer software program. The average colony number was calculated and photographed from three separate experiments (TPA, upper right; EGF, bottom right) and representative plates are shown. Significant differences were evaluated using the Student's _t_-test and the respective asterisks indicate a significant decrease in TPA- or EGF-induced cell transformation compared with si-MOCK cells (*, p < 0.0001). B, JB6 Cl41 cells were transiently transfected with si-MOCK or si-MSK and a plasmid mixture containing the AP-1-luciferase reporter gene (0.25 μg) or the pCMV-β-Gal gene (0.05 μg). At 36 h after transfection, cells were starved for 24 h by incubating in serum-deprived MEM at 37°C in a 5% CO2 atmosphere and then incubated with 20 ng/mL of TPA (upper panel) or 10 ng/mL of EGF (bottom panel) for 12 h. C, JB6 Cl41 cells stably expressing si-MOCK or si-MSK1 were transiently transfected with a plasmid mixture containing the c-fos-luciferase reporter gene (0.1 μg) or the pCMV-β-Gal gene (0.05 μg) for normalizing. At 36 h after transfection, cells were starved for 24 h by incubating in serum-deprived MEM at 37°C in a 5% CO2 atmosphere and then incubated with 20 ng/mL of TPA (upper panel) or 10 ng/mL of EGF (bottom panel) for 12 h. Significant differences were evaluated using the Student's _t_-test and the respective asterisks indicate a significant decrease in TPA- or EGF-induced AP-1 activation compared with si-MOCK cells (*, p < 0.01 and **, p < 0.005). D, si-MOCK or si-MSK1 transfected cells (6 × 10⁵/mL) were starved in 0.1% FBS-MEM for 24 h at 37°C in a 5% CO2 atmosphere and then stimulated with 20 ng/mL of TPA (left panel) or 10 ng/mL of EGF (right panel) for various periods of time. Histone proteins (1 μg) were prepared for Western blot analysis and the phosphorylation of histone H3 at Ser10 or Ser28 expression was detected with specific antibodies. Total histone H3 was used to verify equal protein loading.
Similar articles
- A derivative of chrysin suppresses two-stage skin carcinogenesis by inhibiting mitogen- and stress-activated kinase 1.
Liu H, Hwang J, Li W, Choi TW, Liu K, Huang Z, Jang JH, Thimmegowda NR, Lee KW, Ryoo IJ, Ahn JS, Bode AM, Zhou X, Yang Y, Erikson RL, Kim BY, Dong Z. Liu H, et al. Cancer Prev Res (Phila). 2014 Jan;7(1):74-85. doi: 10.1158/1940-6207.CAPR-13-0133. Epub 2013 Oct 29. Cancer Prev Res (Phila). 2014. PMID: 24169959 Free PMC article. - Ribosomal S6 kinase 2 is a key regulator in tumor promoter induced cell transformation.
Cho YY, Yao K, Kim HG, Kang BS, Zheng D, Bode AM, Dong Z. Cho YY, et al. Cancer Res. 2007 Sep 1;67(17):8104-12. doi: 10.1158/0008-5472.CAN-06-4668. Cancer Res. 2007. PMID: 17804722 Free PMC article. - Chromatin modification of the trefoil factor 1 gene in human breast cancer cells by the Ras/mitogen-activated protein kinase pathway.
Espino PS, Li L, He S, Yu J, Davie JR. Espino PS, et al. Cancer Res. 2006 May 1;66(9):4610-6. doi: 10.1158/0008-5472.CAN-05-4251. Cancer Res. 2006. PMID: 16651411 - PI-3 kinase in signal transduction, cell transformation, and as a target for chemoprevention of cancer.
Dong Z, Huang C, Ma WY. Dong Z, et al. Anticancer Res. 1999 Sep-Oct;19(5A):3743-7. Anticancer Res. 1999. PMID: 10625951 Review. - MSK activation and physiological roles.
Arthur JS. Arthur JS. Front Biosci. 2008 May 1;13:5866-79. doi: 10.2741/3122. Front Biosci. 2008. PMID: 18508628 Review.
Cited by
- MiR-148a attenuates paclitaxel resistance of hormone-refractory, drug-resistant prostate cancer PC3 cells by regulating MSK1 expression.
Fujita Y, Kojima K, Ohhashi R, Hamada N, Nozawa Y, Kitamoto A, Sato A, Kondo S, Kojima T, Deguchi T, Ito M. Fujita Y, et al. J Biol Chem. 2010 Jun 18;285(25):19076-84. doi: 10.1074/jbc.M109.079525. Epub 2010 Apr 20. J Biol Chem. 2010. PMID: 20406806 Free PMC article. - The histone modifications governing TFF1 transcription mediated by estrogen receptor.
Li Y, Sun L, Zhang Y, Wang D, Wang F, Liang J, Gui B, Shang Y. Li Y, et al. J Biol Chem. 2011 Apr 22;286(16):13925-36. doi: 10.1074/jbc.M111.223198. Epub 2011 Mar 4. J Biol Chem. 2011. PMID: 21378170 Free PMC article. - Histone H3 phospho-regulation by KimH3 in both interphase and mitosis.
Wang J, Tian X, Feng C, Song C, Yu B, Wang Y, Ji X, Zhang X. Wang J, et al. iScience. 2023 Mar 10;26(4):106372. doi: 10.1016/j.isci.2023.106372. eCollection 2023 Apr 21. iScience. 2023. PMID: 37013187 Free PMC article. - MSK1 promotes cell proliferation and metastasis in uveal melanoma by phosphorylating CREB.
Li J, Liu X, Wang W, Li C, Li X. Li J, et al. Arch Med Sci. 2019 Jun 14;16(5):1176-1188. doi: 10.5114/aoms.2019.85810. eCollection 2020. Arch Med Sci. 2019. PMID: 32864007 Free PMC article. - VRK3 depletion induces cell cycle arrest and metabolic reprogramming of pontine diffuse midline glioma - H3K27 altered cells.
Menez V, Kergrohen T, Shasha T, Silva-Evangelista C, Le Dret L, Auffret L, Subecz C, Lancien M, Ajlil Y, Vilchis IS, Beccaria K, Blauwblomme T, Oberlin E, Grill J, Castel D, Debily MA. Menez V, et al. Front Oncol. 2023 Oct 10;13:1229312. doi: 10.3389/fonc.2023.1229312. eCollection 2023. Front Oncol. 2023. PMID: 37886173 Free PMC article.
References
- Chang L, Karin M. Mammalian MAP kinase signalling cascades. Nature. 2001;410:37–40. - PubMed
- Ballif BA, Blenis J. Molecular mechanisms mediating mammalian mitogen-activated protein kinase (MAPK) kinase (MEK)-MAPK cell survival signals. Cell Growth Differ. 2001;12:397–408. - PubMed
- Papatsoris AG, Papavassiliou AG. Molecular ‘palpation’ of BPH: a tale of MAPK signalling? Trends Mol Med. 2001;7:288–92. - PubMed
- Robinson MJ, Cobb MH. Mitogen-activated protein kinase pathways. Curr Opin Cell Biol. 1997;9:180–6. - PubMed
Publication types
MeSH terms
Substances
Grants and funding
- R01 CA077646/CA/NCI NIH HHS/United States
- R01 CA111356/CA/NCI NIH HHS/United States
- CA11536/CA/NCI NIH HHS/United States
- R01 CA120388-01/CA/NCI NIH HHS/United States
- R01 CA120388/CA/NCI NIH HHS/United States
- R01 CA077646-05/CA/NCI NIH HHS/United States
- R01 CA111356-01/CA/NCI NIH HHS/United States
- CA120388/CA/NCI NIH HHS/United States
- CA77646/CA/NCI NIH HHS/United States
LinkOut - more resources
Full Text Sources
Molecular Biology Databases


