Extensive variation between inbred mouse strains due to endogenous L1 retrotransposition - PubMed (original) (raw)
Extensive variation between inbred mouse strains due to endogenous L1 retrotransposition
Keiko Akagi et al. Genome Res. 2008 Jun.
Abstract
Numerous inbred mouse strains comprise models for human diseases and diversity, but the molecular differences between them are mostly unknown. Several mammalian genomes have been assembled, providing a framework for identifying structural variations. To identify variants between inbred mouse strains at a single nucleotide resolution, we aligned 26 million individual sequence traces from four laboratory mouse strains to the C57BL/6J reference genome. We discovered and analyzed over 10,000 intermediate-length genomic variants (from 100 nucleotides to 10 kilobases), distinguishing these strains from the C57BL/6J reference. Approximately 85% of such variants are due to recent mobilization of endogenous retrotransposons, predominantly L1 elements, greatly exceeding that reported in humans. Many genes' structures and expression are altered directly by polymorphic L1 retrotransposons, including Drosha (also called Rnasen), Parp8, Scn1a, Arhgap15, and others, including novel genes. L1 polymorphisms are distributed nonrandomly across the genome, as they are excluded significantly from the X chromosome and from genes associated with the cell cycle, but are enriched in receptor genes. Thus, recent endogenous L1 retrotransposition has diversified genomic structures and transcripts extensively, distinguishing mouse lineages and driving a major portion of natural genetic variation.
Figures
Figure 1.
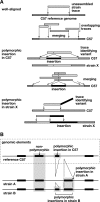
Discovery of structural variation between inbred mouse strains by WGS trace alignment. (A) Presented here is a schematic illustrating several types of alignments of WGS traces against the reference genome (Supplemental Fig. 1). (Top) “Well-aligned” traces aligned almost completely at unique locations in the C57 reference genome (light gray). Overlapping sequences were merged into a contig. (Middle) “Polymorphic insertion in C57” traces identify an indel present in the C57 reference genome, but absent from the genome of the trace’s source, unassembled strain X. The insertion (black) interrupts the trace’s alignment (light gray) with the reference sequence. Overlapping traces were merged, identifying a unique indel. (Bottom) “Polymorphic insertion in strain X” represents an indel present in that strain (black) but absent from the reference genome. The sequence trace from strain X aligns well, but only partially, to the reference genome; another contiguous part of the trace does not align to the reference genome, identifying an indel variant (Supplemental Fig. 1). (B) An example of aligned genomic features in reference C57 and unassembled strains A and B genomic sequences, identifying various intermediate-length elements including polymorphic, nonpolymorphic, and reference sequences such as L1 retrotransposons. A sequence called an insertion in one strain might alternatively be considered a deletion from another.
Figure 2.
Intermediate-sized structural variation between mouse strains due to endogenous retrotransposition. (A) Distribution of lengths of all variants identified here (ranging from 100 nt to 10 kb), predicted from WGS trace alignments. Each polymorphic integrant is present in the C57 reference genome and absent from at least one of the unassembled strain(s). (Legend) The percentages indicate the relative composition of each variant, identified by RepeatMasker as repetitive element sequences. (B) Classes of repeats in variants. Polymorphisms present in C57, containing >70% RepeatMasker content and ranging in length from 100 nt to 10 kb include: Alu, 5.4% of the total number of such variants; B2 SINEs, 19.2%; ERV1, 1.8%; ERV-K, 16.4%; ERV-L, 3.5%; L1, 38.8%; MaLR, 4.0%; simple repeats, 8.8%; and other, 2.0%. L1 retrotransposition is the most numerous cause of intermediate length variation between the strains.
Figure 3.
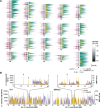
Chromosomal distribution of mouse L1s and SNPs. (A) A schematic mouse karyotype containing 19 autosomes and the X chromosome (vertical bars, middle), indicates variable G:C content (grayscale). Darker shades indicate (G+C)-rich regions. Histograms display exon content (left, maroon), reference C57 strain L1 retrotransposons (right, green), and polymorphic L1s absent from an unassembled strain(s) (right, yellow), as nucleotide per 100 kb genomic sequence (scale bars, 10 kb per 100 kb genomic sequence, below X chromosome). (B) Densities of SNPs (lavender) and L1 variants (yellow) are compared between two strains each along chromosome 4 and (inset) at its coordinates 70–80 Mb. (Left) A/J vs. C57 reference; (right) DBA/2J vs. C57, nucleotide per 10 kb. Note that the nucleotide scale differs between L1 (_Y_-axis, left) and SNPs (right) by a factor of 100×. Polymorphic L1 integrants in chromosomal regions lacking SNPs in these pairwise comparisons are marked (arrows).
Figure 4.
Polymorphic L1s are bona fide products of recent retrotransposition. The length distribution of (A) polymorphic L1s (absent from at least one of the unassembled strains), (B) nonpolymorphic L1s (present in all five strains), and (C) reference L1s (present in the C57 genome) is presented for elements with both a poly(A) tail and TSD (white), TSD alone (light gray), or neither (black). Polymorphic L1s are much more likely to be full length and to have both a poly(A) tail and TSD. See Supplemental Figure 3 and Supplemental Table 6.
Figure 5.
Transcriptional variation due to L1 variants. (A) (Top) Genomic structure of Drosha (Rnasen) on mouse chromosome 15 (Feb. 2006 assembly), presented left to right (5′ to 3′), with exons (black vertical lines); ORF (yellow arrow); intronic, antisense L1 polymorphism including its 5′ UTR, ORF-1 and ORF-2, and 3′ UTR (inset); and L1 target site (red dot) as indicated. The L1 target-site sequence, presented in the orientation of Drosha, is 5′-TCGCGCTTTGGCTTCTTT. Also presented are fusion L1-Drosha and native Drosha spliced, poly(A)+ transcript structures including relative lengths and numbers of Drosha (tan rectangle) and antisense L1 (purple) exons. Above each transcript is a schematic indicating predicted translation products (from start to stop codons) including RNaseIII and double-stranded RNA-binding domains, and low complexity (pink) and coiled-coil (light blue) domains (annotated by SMART program). (Middle) RT–PCR assay for fusion L1-Drosha and native transcripts in total RNA from five mouse strain testes and assay for fusion L1-Drosha transcript from Balb/cJ tissues as indicated. (Bottom) Northern blot probed for Drosha transcripts, indicating fusion L1-Drosha expression only in DBA/2J mice. (B) (Top) Genomic structure of Parp8 on the minus strand of chromosome 13, including genomic features as in A. The L1 target site sequence, in the orientation of Parp8, is 5′-CCTCCGACGTTAAAG. Also presented are fusion L1-Parp8 and native Parp8 spliced, poly(A)+ transcripts, including relative exon lengths (tan rectangles), numbers, and the antisense L1 exon (purple). Above each transcript is a schematic indicating predicted translation products including internally repeated (RPT) and poly(ADP-ribose) polymerase (PARP) catalytic domains, and low-complexity (pink) domains (SMART). (Bottom) RT–PCR assay for fusion L1-Parp8 and native transcripts. (C) (Top) Genomic and transcript structures for 1ASII-1, a novel, spliced transcript initiated by a polymorphic L1 on the minus strand of chromosome 8, including genomic features as in A. The L1 target-site sequence, presented in the sense orientation of 1ASII-1, is 5′-GACGTATAGACAAGAA. Also presented is poly(A)+ transcript 1ASII-1 (open arrow), including its relative exon lengths (tan rectangles), numbers and the antisense L1 exon (purple). Above it is a schematic indicating predicted translation products with low complexity (pink) domain as indicated (SMART program). (Bottom) RT-PCR assay for fusion L1-1ASII-1 and native (lacking the L1 exon) transcripts and for the fusion L1 transcript in Balb/cJ tissues as indicated. This L1 variant initiates transcription in testis and 11-d embryo, only in strains containing the variant.
Figure 6.
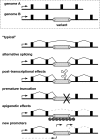
Genomic and transcriptional variation due to endogenous transposition. (Top) Schematic of allelic variants A and B at a genomic locus including a promoter (arrow), exons (filled boxes), introns (underlying black line), and a polymorphic transposon integrant (open rectangle, genome B) with target-site duplications (gray circles). (Bottom) Possible forms of transcriptional variation due to a transposon integrant. (“Typical” transcript) Because transposons are ubiquitous, a typical transcript might lack an intronic integrant by splicing between exons. (Alternative splicing) Transcripts might include portions of transposon integrants due to their internal splice donor and splice acceptor sites. (Post-transcriptional effects) Transposon sequences may introduce autoregulatory elements affecting RNA stability, intracellular compartmentalization, etc. (Premature truncation) Similar to alternative splicing, except that transcripts end prematurely due to a transcription terminator in the transposon. (Epigenetic effects) Read-through transcription may be repressed by heterochromatin, DNA methylation, and/or other epigenetic controls at transposon integrants. (New promoters) Gene expression and structure may be altered by introduction of new sense and/or antisense promoters in transposon integrants. This is the main form of transcriptional variation described in this report.
Similar articles
- The genomic landscape shaped by selection on transposable elements across 18 mouse strains.
Nellåker C, Keane TM, Yalcin B, Wong K, Agam A, Belgard TG, Flint J, Adams DJ, Frankel WN, Ponting CP. Nellåker C, et al. Genome Biol. 2012 Jun 15;13(6):R45. doi: 10.1186/gb-2012-13-6-r45. Genome Biol. 2012. PMID: 22703977 Free PMC article. - Reading between the LINEs: human genomic variation induced by LINE-1 retrotransposition.
Sheen FM, Sherry ST, Risch GM, Robichaux M, Nasidze I, Stoneking M, Batzer MA, Swergold GD. Sheen FM, et al. Genome Res. 2000 Oct;10(10):1496-508. doi: 10.1101/gr.149400. Genome Res. 2000. PMID: 11042149 Free PMC article. - An antisense promoter in mouse L1 retrotransposon open reading frame-1 initiates expression of diverse fusion transcripts and limits retrotransposition.
Li J, Kannan M, Trivett AL, Liao H, Wu X, Akagi K, Symer DE. Li J, et al. Nucleic Acids Res. 2014 Apr;42(7):4546-62. doi: 10.1093/nar/gku091. Epub 2014 Feb 3. Nucleic Acids Res. 2014. PMID: 24493738 Free PMC article. - Biology of mammalian L1 retrotransposons.
Ostertag EM, Kazazian HH Jr. Ostertag EM, et al. Annu Rev Genet. 2001;35:501-38. doi: 10.1146/annurev.genet.35.102401.091032. Annu Rev Genet. 2001. PMID: 11700292 Review. - The Influence of LINE-1 and SINE Retrotransposons on Mammalian Genomes.
Richardson SR, Doucet AJ, Kopera HC, Moldovan JB, Garcia-Perez JL, Moran JV. Richardson SR, et al. Microbiol Spectr. 2015 Apr;3(2):MDNA3-0061-2014. doi: 10.1128/microbiolspec.MDNA3-0061-2014. Microbiol Spectr. 2015. PMID: 26104698 Free PMC article. Review.
Cited by
- Cocaine produces conditioned place aversion in mice with a cocaine-insensitive dopamine transporter.
O'Neill B, Tilley MR, Gu HH. O'Neill B, et al. Genes Brain Behav. 2013 Feb;12(1):34-8. doi: 10.1111/j.1601-183X.2012.00872.x. Epub 2012 Nov 22. Genes Brain Behav. 2013. PMID: 23083326 Free PMC article. - Genome-wide mapping and assembly of structural variant breakpoints in the mouse genome.
Quinlan AR, Clark RA, Sokolova S, Leibowitz ML, Zhang Y, Hurles ME, Mell JC, Hall IM. Quinlan AR, et al. Genome Res. 2010 May;20(5):623-35. doi: 10.1101/gr.102970.109. Epub 2010 Mar 22. Genome Res. 2010. PMID: 20308636 Free PMC article. - Whole-genome resequencing allows detection of many rare LINE-1 insertion alleles in humans.
Ewing AD, Kazazian HH Jr. Ewing AD, et al. Genome Res. 2011 Jun;21(6):985-90. doi: 10.1101/gr.114777.110. Epub 2010 Oct 27. Genome Res. 2011. PMID: 20980553 Free PMC article. - High-throughput sequencing reveals extensive variation in human-specific L1 content in individual human genomes.
Ewing AD, Kazazian HH Jr. Ewing AD, et al. Genome Res. 2010 Sep;20(9):1262-70. doi: 10.1101/gr.106419.110. Epub 2010 May 20. Genome Res. 2010. PMID: 20488934 Free PMC article. - Reduced pachytene piRNAs and translation underlie spermiogenic arrest in Maelstrom mutant mice.
Castañeda J, Genzor P, van der Heijden GW, Sarkeshik A, Yates JR 3rd, Ingolia NT, Bortvin A. Castañeda J, et al. EMBO J. 2014 Sep 17;33(18):1999-2019. doi: 10.15252/embj.201386855. Epub 2014 Jul 25. EMBO J. 2014. PMID: 25063675 Free PMC article.
References
- An W., Han J.S., Wheelan S.J., Davis E.S., Coombes C.E., Ye P., Triplett C., Boeke J.D., Han J.S., Wheelan S.J., Davis E.S., Coombes C.E., Ye P., Triplett C., Boeke J.D., Wheelan S.J., Davis E.S., Coombes C.E., Ye P., Triplett C., Boeke J.D., Davis E.S., Coombes C.E., Ye P., Triplett C., Boeke J.D., Coombes C.E., Ye P., Triplett C., Boeke J.D., Ye P., Triplett C., Boeke J.D., Triplett C., Boeke J.D., Boeke J.D. Active retrotransposition by a synthetic L1 element in mice. Proc. Natl. Acad. Sci. 2006;103:18662–18667. - PMC - PubMed
- Beck J.A., Lloyd S., Hafezparast M., Lennon-Pierce M., Eppig J.T., Festing M.F., Fisher E.M., Lloyd S., Hafezparast M., Lennon-Pierce M., Eppig J.T., Festing M.F., Fisher E.M., Hafezparast M., Lennon-Pierce M., Eppig J.T., Festing M.F., Fisher E.M., Lennon-Pierce M., Eppig J.T., Festing M.F., Fisher E.M., Eppig J.T., Festing M.F., Fisher E.M., Festing M.F., Fisher E.M., Fisher E.M. Genealogies of mouse inbred strains. Nat. Genet. 2000;24:23–25. - PubMed
- Bestor T.H. Cytosine methylation mediates sexual conflict. Trends Genet. 2003;19:185–190. - PubMed
- Boissinot S., Entezam A., Furano A.V., Entezam A., Furano A.V., Furano A.V. Selection against deleterious LINE-1-containing loci in the human lineage. Mol. Biol. Evol. 2001;18:926–935. - PubMed
Publication types
MeSH terms
Grants and funding
- N01 CO012400/CA/NCI NIH HHS/United States
- NIH0011255384/ImNIH/Intramural NIH HHS/United States
- Z01 BC010628/ImNIH/Intramural NIH HHS/United States
- N01-CO-12400/CO/NCI NIH HHS/United States
LinkOut - more resources
Full Text Sources
Molecular Biology Databases


