Hydrolysis of phosphatidylinositol 4,5-bisphosphate mediates calcium-induced inactivation of TRPV6 channels - PubMed (original) (raw)
Hydrolysis of phosphatidylinositol 4,5-bisphosphate mediates calcium-induced inactivation of TRPV6 channels
Baskaran Thyagarajan et al. J Biol Chem. 2008.
Abstract
TRPV6 is a member of the transient receptor potential superfamily of ion channels that facilitates Ca(2+) absorption in the intestines. These channels display high selectivity for Ca(2+), but in the absence of divalent cations they also conduct monovalent ions. TRPV6 channels have been shown to be inactivated by increased cytoplasmic Ca(2+) concentrations. Here we studied the mechanism of this Ca(2+)-induced inactivation. Monovalent currents through TRPV6 substantially decreased after a 40-s application of Ca(2+), but not Ba(2+). We also show that Ca(2+), but not Ba(2+), influx via TRPV6 induces depletion of phosphatidylinositol 4,5-bisphosphate (PI(4,5)P(2) or PIP(2)) and the formation of inositol 1,4,5-trisphosphate. Dialysis of DiC(8) PI(4,5)P(2) through the patch pipette inhibited Ca(2+)-dependent inactivation of TRPV6 currents in whole-cell patch clamp experiments. PI(4,5)P(2) also activated TRPV6 currents in excised patches. PI(4)P, the precursor of PI(4,5)P(2), neither activated TRPV6 in excised patches nor had any effect on Ca(2+)-induced inactivation in whole-cell experiments. Conversion of PI(4,5)P(2) to PI(4)P by a rapamycin-inducible PI(4,5)P(2) 5-phosphatase inhibited TRPV6 currents in whole-cell experiments. Inhibiting phosphatidylinositol 4 kinases with wortmannin decreased TRPV6 currents and Ca(2+) entry into TRPV6-expressing cells. We propose that Ca(2+) influx through TRPV6 activates phospholipase C and the resulting depletion of PI(4,5)P(2) contributes to the inactivation of TRPV6.
Figures
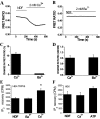
FIGURE 1.
Effects of Ca2+ and Ba2+ on monovalent currents of TRPV6 channels expressed in HEK293 cells. A and B, time courses of representative whole-cell recordings at a holding potential of –60 mV in HEK293 cells expressing GFP and TRPV6. Monovalent currents were initiated by the addition of NDF solution containing 2 m
m
EGTA for 20 s followed by addition of 2 m
m
Ca2+ or Ba2+ in NDF for 40 s. Note that the NDF solution at the beginning of the experiment has trace amounts of calcium in the low micromolar range that block monovalent currents through TRPV6. 1, 2, and 3 represent three alternating pulses of 0 Ca2+ (EGTA) and 2 m
m
Ca2+ or Ba2+. C, representative current trace in HEK cells expressing GFP, but not TRPV6. D and E, normalized average current amplitudes ± S.E. remaining before the addition of Ca2+ (n = 8) or Ba2+ (n = 8) normalized to the first pulse in TRPV6-expressing cells. **, p < 0.001. F, average current amplitudes evoked by pulses of EGTA in HEK cells expressing GFP alone.
FIGURE 2.
Ca2+, but not Ba2+, induces PI(4,5)P2 hydrolysis in TRPV6-expressing cells. Fluorescence was measured in HEK293 cells expressing TRPV6 and the CFP- and YFP-tagged PLCδ1 PH domains as described under “Experimental Procedures.” Cells were kept in NDF solution for 20 min before the experiment. During the measurement, 2 m
m
Ca2+ or Ba2+ was added at 200 s. A and B represent the time courses of FRET ratio for Ca2+ and Ba2+, respectively. C represents the mean ± S.E. for change in FRET ratio signals, calculated the following way. We divided the value 2 min after the addition of 2 m
m
Ca2+ (n = 5) or Ba2+ (n = 5) by the value before addition of Ca2+ to result in F and then 100 – (100 × F) was plotted. D represents the mean of change in 340/380 nm ratio ± S.E. for Ca2+ (n = 31) or Ba2+ (n = 36) in fura-2-loaded cells expressing TRPV6. E, IP3 measurement in TRPV6-expressing HEK-293 cells in response to 2 m
m
Ca2+ or Ba2+.*, p < 0.05. F, IP3 measurement in non-transfected HEK293 cells in response to 2 m
m
Ca2+ and in response to 100 μ
m
extracellular ATP. Error bars represent average ± S.E.
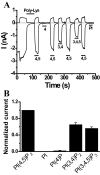
FIGURE 3.
PI(4,5)P2 activates TRPV6 in excised patches. Currents were measured in large membrane patches excised from Xenopus oocytes expressing TRPV6 using the ramp protocol from –100 to +100 mV applied every second (0.25 mV/ms). Representative traces show currents at +100 and –100 mV, upper and lower traces, respectively. Phosphoinositides were applied directly to the intracellular surface of the patch, as indicated by the horizontal bars. A, representative trace describing the effects of various phosphoinositides. To facilitate rundown, 30 μg/ml poly-lysine was added before the application of the phosphoinositides in two of six experiments; in the remaining experiments phosphoinositides were applied after spontaneous run down of the currents. The effects of phosphoinositides were indistinguishable in polylysine-treated and untreated patches, and thus the results were pooled. B illustrates statistics for –100 mV (n = 6) of the effects of different phosphoinositides compared with PI(4,5)P2. The average current ± S.E. for various phosphoinositides was normalized to PI(4,5)P2 responses. All phosphoinositides were short acyl chain (DiC8) applied at a concentration of 50 μ
m
.
FIGURE 4.
PI(4,5)P2, but not PI(4)P, prevents Ca2+-induced inactivation of TRPV6 channels in HEK293 cells. A–C represent the time courses of whole-cell TRPV6 currents in control (n = 9), PI(4)P (n = 7), or PI(4,5)P2 (n = 9) dialyzed cells recorded at a constant holding potential of –60 mV. Recordings were performed 5–10 min after the formation of whole-cell configuration. Short acyl chain (DiC8) PI(4)P or PI(4,5)P2 at a concentration of 50 μ
m
were dialyzed through the patch pipette. D–F represent the average current amplitudes ± S.E. normalized to the peak of the first pulse of 0 Ca2+ in control, PI(4)P, and PI(4,5)P2 dialyzed cells, respectively. **, p < 0.001.
FIGURE 5.
Translocation of the PI(4,5)P2 5-phosphatase to the plasma membrane inhibits TRPV6. HEK293 cells were transfected with TRPV6 and the CFP-tagged FRB and either the RFP-tagged FKBP12 fused to the phosphatase domain of the PIP2 5-phosphatase (5_′_-Ptase) or the RFP-tagged FKBP12 (Control). Whole-cell recordings were performed at a constant holding potential of –60 mV in NDF solution. Monovalent currents were initiated with NDF solution containing 2 m
m
EGTA. Translocation of the phosphatase domain was induced by the addition of 100 n
m
rapamycin. A and B represent the time course of monovalent currents in TRPV6 cells at a holding potential of –60 mV before and after addition of 100 n
m
rapamycin in 5-phosphatase and control cells, respectively. C and D represent the mean ± S.E. of current values 30 s after initiation of monovalent current by the addition of 0 Ca2+ (EGTA) solution and 30 s after the addition of rapamycin in 5-phosphatase (n = 9) or control (n = 10) cells, respectively. **, p < 0.001.
FIGURE 6.
Wortmannin (WMN) inhibits monovalent currents as well as Ca2+ entry through TRPV6 channels. A and B represent the time courses of whole-cell TRPV6 currents measured in control and WMN-pretreated (10 μ
m
for 30 min) cells at a constant holding potential of –60 mV. C, normalized whole-cell monovalent currents are shown for control and WMN-pretreated cells. The mean currents ± S.E. were measured at two time points (1 and 2) and represent control (n = 8) and WMN-pretreated (n = 6) cells. D represents the time courses of changes in the ratio of fura-2 fluorescence upon addition of 2 m
m
Ca2+ in WMN-pretreated cells and untreated controls. E, the average change in fluorescence ratio ± S.E. for the control (n = 32) and WMN-pretreated (n = 66) cells measured at two time points, 1 and 2, representing 30 and 150 s after initiation of Ca2+ entry was plotted. **, p < 0.001.
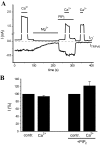
FIGURE 7.
The effect of Ca2+ on TRPV6 in excised patches. A, macroscopic currents were measured in excised patches from Xenopus oocytes expressing TRPV6, using the solutions described under “Experimental Procedures.” The applications of 10 μ
m
free Ca2+, 43 μ
m
free Mg2+, and 50 μ
m
diC8 PI(4,5)P2 are indicated with horizontal lines. Holding potential was 0 mV, and then a 150-ms long step to –103 mV, followed by a step to +100 mV, was applied once every second. The changes at +100 mV mainly correspond to the Ca2+-activated Cl– currents (_ICl_–), whereas the changes at –103 mV correspond exclusively to TRPV6 currents. Note the lack of any current in response to Ca2+ at –103 mV after TRPV6 current rundown at the end of the experiment (third pulse of Ca2+). B, normalized current changes induced by Ca2+ at –103 mV (mean ± S.E., n = 8).
Similar articles
- Phospholipase C-mediated regulation of transient receptor potential vanilloid 6 channels: implications in active intestinal Ca2+ transport.
Thyagarajan B, Benn BS, Christakos S, Rohacs T. Thyagarajan B, et al. Mol Pharmacol. 2009 Mar;75(3):608-16. doi: 10.1124/mol.108.052449. Epub 2008 Dec 10. Mol Pharmacol. 2009. PMID: 19073818 Free PMC article. - Interplay between calmodulin and phosphatidylinositol 4,5-bisphosphate in Ca2+-induced inactivation of transient receptor potential vanilloid 6 channels.
Cao C, Zakharian E, Borbiro I, Rohacs T. Cao C, et al. J Biol Chem. 2013 Feb 22;288(8):5278-90. doi: 10.1074/jbc.M112.409482. Epub 2013 Jan 8. J Biol Chem. 2013. PMID: 23300090 Free PMC article. - The recombinant human TRPV6 channel functions as Ca2+ sensor in human embryonic kidney and rat basophilic leukemia cells.
Bödding M, Wissenbach U, Flockerzi V. Bödding M, et al. J Biol Chem. 2002 Sep 27;277(39):36656-64. doi: 10.1074/jbc.M202822200. Epub 2002 Jul 23. J Biol Chem. 2002. PMID: 12138163 - Structure and function of the calcium-selective TRP channel TRPV6.
Yelshanskaya MV, Nadezhdin KD, Kurnikova MG, Sobolevsky AI. Yelshanskaya MV, et al. J Physiol. 2021 May;599(10):2673-2697. doi: 10.1113/JP279024. Epub 2020 Mar 13. J Physiol. 2021. PMID: 32073143 Free PMC article. Review. - TRPV5 and TRPV6 in transcellular Ca(2+) transport: regulation, gene duplication, and polymorphisms in African populations.
Peng JB. Peng JB. Adv Exp Med Biol. 2011;704:239-75. doi: 10.1007/978-94-007-0265-3_14. Adv Exp Med Biol. 2011. PMID: 21290300 Review.
Cited by
- Structural mechanisms of TRPV6 inhibition by ruthenium red and econazole.
Neuberger A, Nadezhdin KD, Sobolevsky AI. Neuberger A, et al. Nat Commun. 2021 Nov 1;12(1):6284. doi: 10.1038/s41467-021-26608-x. Nat Commun. 2021. PMID: 34725357 Free PMC article. - Ca2+ Regulation of TRP Ion Channels.
Hasan R, Zhang X. Hasan R, et al. Int J Mol Sci. 2018 Apr 23;19(4):1256. doi: 10.3390/ijms19041256. Int J Mol Sci. 2018. PMID: 29690581 Free PMC article. Review. - Transient receptor potential channels meet phosphoinositides.
Nilius B, Owsianik G, Voets T. Nilius B, et al. EMBO J. 2008 Nov 5;27(21):2809-16. doi: 10.1038/emboj.2008.217. Epub 2008 Oct 16. EMBO J. 2008. PMID: 18923420 Free PMC article. Review. - Phosphatidylinositol 4,5-bisphosphate and loss of PLCgamma activity inhibit TRPM channels required for oscillatory Ca2+ signaling.
Xing J, Strange K. Xing J, et al. Am J Physiol Cell Physiol. 2010 Feb;298(2):C274-82. doi: 10.1152/ajpcell.00394.2009. Epub 2009 Nov 18. Am J Physiol Cell Physiol. 2010. PMID: 19923421 Free PMC article. - TRPV6 channel mediates alcohol-induced gut barrier dysfunction and systemic response.
Meena AS, Shukla PK, Bell B, Giorgianni F, Caires R, Fernández-Peña C, Beranova S, Aihara E, Montrose MH, Chaib M, Makowski L, Neeli I, Radic MZ, Vásquez V, Jaggar JH, Cordero-Morales JF, Rao R. Meena AS, et al. Cell Rep. 2022 Jun 14;39(11):110937. doi: 10.1016/j.celrep.2022.110937. Cell Rep. 2022. PMID: 35705057 Free PMC article.
References
- Montell, C. (2005) Sci. STKE 2005 re3. - PubMed
- Nilius, B., Owsianik, G., Voets, T., and Peters, J. A. (2007) Physiol. Rev. 87 165–217 - PubMed
- Clapham, D. E. (2003) Nature 426 517–524 - PubMed
- Hoenderop, J. G., Nilius, B., and Bindels, R. J. (2005) Physiol. Rev. 85 373–422 - PubMed
- Vennekens, R., Voets, T., Bindels, R. J., Droogmans, G., and Nilius, B. (2002) Cell Calcium 31 253–264 - PubMed
Publication types
MeSH terms
Substances
LinkOut - more resources
Full Text Sources
Research Materials
Miscellaneous


