PTEN represses RNA polymerase III-dependent transcription by targeting the TFIIIB complex - PubMed (original) (raw)
PTEN represses RNA polymerase III-dependent transcription by targeting the TFIIIB complex
Annette Woiwode et al. Mol Cell Biol. 2008 Jun.
Abstract
PTEN, a tumor suppressor whose function is frequently lost in human cancers, possesses a lipid phosphatase activity that represses phosphatidylinositol 3-kinase (PI3K) signaling, controlling cell growth, proliferation, and survival. The potential for PTEN to regulate the synthesis of RNA polymerase (Pol) III transcription products, including tRNAs and 5S rRNAs, was evaluated. The expression of PTEN in PTEN-deficient cells repressed RNA Pol III transcription, whereas decreased PTEN expression enhanced transcription. Transcription repression by PTEN was uncoupled from PTEN-mediated effects on the cell cycle and was independent of p53. PTEN acts through its lipid phosphatase activity, inhibiting the PI3K/Akt/mTOR/S6K pathway to decrease transcription. PTEN, through the inactivation of mTOR, targets the TFIIIB complex, disrupting the association between TATA-binding protein and Brf1. Kinetic analysis revealed that PTEN initially induces a decrease in the serine phosphorylation of Brf1, leading to a selective reduction in the occupancy of all TFIIIB subunits on tRNA(Leu) genes, whereas prolonged PTEN expression results in the enhanced serine phosphorylation of Bdp1. Together, these results demonstrate a new class of genes regulated by PTEN through its ability to repress the activation of PI3K/Akt/mTOR/S6K signaling.
Figures
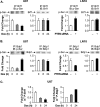
FIG. 1.
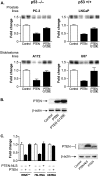
PTEN represses RNA Pol III transcription via its lipid phosphatase activity independently of p53. (A) PTEN expression in PTEN null cell lines decreases RNA Pol III transcription. Prostate PC-3 (p53−/−) and LnCap (p53+/+) and glioblastoma A172 (p53−/−) and U87 (p53+/+) cell lines were transiently cotransfected with a tRNA gene reporter and an expression vector for PTEN or PTEN-G129E, a lipid phosphatase-defective mutant. Total RNA was isolated, and RNase protection assays were performed to determine the amounts of transcript. The change in transcription is calculated based on reporter gene activity in cells transfected with an empty vector control. (B) Expression of PTEN and PTEN-G129E in U87 cells. Total protein was isolated from cells transfected as described above (A) and subjected to immunoblot analysis using antibodies against PTEN or β-actin. Representative autoradiographs are shown. (C) Targeting PTEN to the nucleus prevents repression of RNA Pol III transcription. U87 cells were transfected with an expression vector for PTEN or PTEN-NLS. (Left) Total RNA was isolated and reverse transcribed. Quantitative real-time PCR analysis was performed to quantify the level of transcription of endogenous precursor tRNALeu, 7SL RNA, and U6 RNA. For quantification, transcript levels were each normalized to values obtained for GAPDH transcripts. The change in transcription is calculated based on the level of transcripts in cells transfected with an empty vector. Graphs represent determinations from at least three biologically independent samples (means ± standard errors [SE]). (Right) Total protein was isolated from transfected cells and subjected to immunoblot analysis using antibodies against PTEN or β-actin. Representative autoradiographs are shown.
FIG. 2.
PTEN selectively represses endogenous RNA Pol III transcription. (A) PTEN expression was induced in stable U87 cell lines. U87-PTEN or U87-PTEN-C124S cells, engineered to induce the expression of PTEN or PTEN-C124S in the presence of DOX, were treated with DOX for 0, 6, or 24 h. Total protein was isolated and subjected to immunoblot analysis using antibodies against PTEN, phospho-Akt (p-Akt), Akt, or β-actin. (B) Induction of PTEN, but not PTEN-C124S, decreases RNA Pol III transcription. Inducible U87-PTEN cells were transfected with the tRNA gene reporter and treated with DOX. Total RNA was isolated, and RNase protection assays were performed. The change in transcription is calculated based on reporter gene activity in untreated cells (0 h). (C) PTEN represses endogenous RNA Pol III transcription. Inducible U87-PTEN cell lines were treated with DOX (24 h), and total RNA was isolated and reverse transcribed. PCR analysis was performed on serial dilutions of cDNAs to quantify the level of transcription of GAPDH mRNA and endogenous precursor transcripts for tRNALeu, tRNATyr, and 7SL RNA. The change in transcription is calculated based on the level of transcripts in untreated cells (0 h). (D) Induction of PTEN, but not PTEN-C124S, decreases RNA Pol III transcription in vitro. Nuclear extracts were prepared from inducible U87-PTEN cell lines treated with DOX (24 h). Transcription assays were carried out using the tRNA gene reporter as a template and 10 or 20 μg of nuclear extract. The change in transcription is calculated based on the level of transcription in untreated cells (0 h). Representative autoradiographs are shown. Graphs represent determinations from at least three biologically independent samples (means ± SE).
FIG. 3.
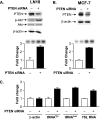
Decreasing PTEN expression selectively enhances RNA Pol III transcription. (A) Reducing expression of PTEN enhances RNA Pol III transcription in LN18 cells. LN18 cells were transfected with PTEN siRNA or control mmRNA. (Top) Total protein was isolated, and immunoblot analysis was performed using antibodies against PTEN, phospho-Akt (p-Akt), Akt, or β-actin. (Bottom) Cells were cotransfected with the tRNA reporter gene and PTEN siRNA or mmRNA. Total RNA was isolated, and RNase protection assays were performed. Representative autoradiographs are shown. The change in transcription is calculated based on reporter gene activity in cells transfected with mmRNA. (B) Reducing expression of PTEN enhances RNA Pol III transcription in MCF-7 cells. MCF-7 cells were transfected as described above (A). (Top) Total protein was isolated, and immunoblot analysis was performed using antibodies against PTEN and β-actin. (Bottom) Total RNA was isolated, and RNase protection assays were performed as described above (A). (C) Decreasing PTEN expression selectively enhances endogenous RNA Pol III transcription. LN18 cells were transfected with PTEN siRNA or mmRNA. Total RNA was isolated and reverse transcribed. PCR analysis was performed on serial dilutions of cDNAs to quantify the expression of β-actin mRNA, precursor tRNATyr, precursor tRNALeu, and 7SL RNA. The change in transcription is calculated based on transcript levels in cells transfected with mmRNA. Graphs represent determinations from at least three biologically independent samples (means ± SE).
FIG. 4.
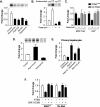
The PI3K/Akt/mTOR signal transduction pathway regulates RNA Pol III transcription. (A) Inhibiting the PI3K/Akt/mTOR pathway represses RNA Pol III transcription. LN18 cells were transfected with the tRNA gene reporter and expression vectors for dominant negative mutants of PI3K (PI3K-DN) or Akt (Akt-DN) or were treated with 0.5 μM wortmannin (6 h) or 100 nM rapamycin for 3 h prior to harvesting of the cells. Total RNA was isolated, and RNase protection assays were performed. The change in transcription is calculated based on reporter gene activity in untreated cells transfected with an empty vector control. (B) Inhibiting mTOR decreases RNA Pol III transcription in vitro. Nuclear extracts were prepared from LN18 cells following treatment with 100 nM rapamycin for 3 h. Transcription assays were carried out using the tRNA reporter gene as a template and 10 or 20 μg of nuclear extract. (C) Inhibiting mTOR decreases endogenous tRNA but not U6 RNA transcription. MCF-10A and U87 cells were treated with 100 nM rapamycin for 3 h prior to harvesting of cells. Total RNA was isolated and reverse transcribed. Quantitative real-time PCR analysis was performed to quantify the level of transcription of endogenous precursor tRNALeu and U6 RNA. For quantification, transcript levels were each normalized to values obtained for GAPDH transcripts. The change in transcription is calculated based on the level of transcripts in cells treated with dimethyl sulfoxide. (D) Activating the PI3K pathway induces RNA Pol III transcription in LnCap cells. LnCap cells were transfected with the tRNA gene reporter, treated with wortmannin, or cotransfected with RasV12C40, a constitutively activated Ras specific for PI3K activation, as designated. Total RNA was isolated, and RNase protection assays were performed. The change in transcription is calculated based on reporter gene activity in untreated cells transfected with an empty vector control. (E) RNA Pol III transcription is induced by the activation of PI3K in primary rat hepatocytes. Primary rat hepatocytes were cotransfected the tRNA gene reporter and RasV12 or RasV12C40 expression vectors and/or were treated with 0.5 μM wortmannin for 6 h prior to harvesting of the cells. Total RNA was isolated, and RNase protection assays were performed. The change in transcription is calculated based on reporter gene activity in untreated cells transfected with an empty vector control. (F) Expression of constitutively activated S6K1 alleviates PTEN-mediated repression of RNA Pol III-dependent transcription. U87 cells were transfected with an expression vector for PTEN and with either constitutively activated S6K1 (S6K1-E389) or an empty vector. Total RNA was isolated and reverse transcribed. Quantitative real-time PCR analysis was performed to quantify the level of transcription of endogenous precursor tRNALeu and 7SL RNA. For quantification, transcript levels were each normalized to values obtained for GAPDH transcripts. The change in transcription is calculated based on the level of transcripts in cells transfected with an empty vector. All graphs represent determinations from at least three biologically independent samples (means ± SE).
FIG. 5.
Reduction of PTEN levels in LN18 cells does not induce cell cycle changes. (A) Reduction of PTEN expression levels does not affect the levels of cyclin D1 or p27. LN18 cells were transfected with PTEN siRNA or mmRNA. Total protein was isolated 24 h posttransfection and subjected to immunoblot analysis with antibodies against cyclin D1, p27, or PTEN. (B) Reduction of PTEN levels does not alter the cell cycle profile. A portion of the LN18 cells transfected with PTEN siRNA or mmRNA (A) and LN18 cells that were not transfected were prepared for FACS analysis, and the numbers of cells in G0/G1, S, and G2/M phases were measured.
FIG. 6.
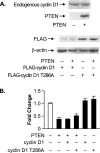
Increased expression of cyclin D1 or nucleus-persistent cyclin D1-T286A does not alleviate PTEN-mediated repression of RNA Pol III transcription in U87 cells. (A) PTEN expression does not alter cyclin D1 expression. U87 cells were transfected with expression vectors for PTEN and/or Flag-cyclin D1 or Flag-cyclin D1-T286A. Total protein was isolated, and immunoblot analysis was performed using antibodies against PTEN, cyclin D1, a Flag epitope, or β-actin. (B) Ectopic expression of cyclin D1 or cyclin D1-T286A does not affect PTEN-mediated repression of RNA Pol III transcription. Cotransfections were performed as described above (A) with the tRNA gene reporter. Total RNA was isolated, and RNase protection assays were performed. The change in transcription is calculated based on reporter gene activity in cells transfected with an empty vector control. Graphs represent determinations from at least three biologically independent samples (means ± SE).
FIG. 7.
PTEN targets TFIIIB. (A) PTEN does not alter the protein levels of the TFIIIB components. (Left) LN18 cells were transfected with PTEN siRNA or mmRNA. (Right) PTEN-inducible U87 cells were treated with DOX (24 h). Total protein was isolated, and immunoblot analysis was performed using antibodies against the proteins indicated. (B) PTEN disrupts the association between TBP and Brf1. LN18 cells were transfected with PTEN siRNA or mmRNA, and total protein was isolated. Coimmunoprecipitation assays (IP) and immunoblot analyses (IB) were performed using antibodies against TBP or Brf1. The change in association is calculated based on values from cells transfected with mmRNA. (C) Rapamycin induces dissociation between TBP and Brf1. U87 cells were treated with 100 nM rapamycin (3 h), and total protein was isolated. Coimmunoprecipitation assays and immunoblot analyses were performed as described above (B). The change in association is calculated based on values from cells treated with dimethyl sulfoxide. Representative autoradiographs are shown. Graphs represent determinations from at least three biologically independent samples (means ± SE).
FIG. 8.
PTEN alters the serine phosphorylation state of Brf1 and Bdp1. (A) PTEN decreases Brf1 serine phosphorylation. (Left) PTEN-inducible U87 cells were treated with DOX for 0, 6, or 24 h. (Right) LN18 cells were transfected with PTEN siRNA or mmRNA. Total protein was isolated and subjected to immunoprecipitation (IP) with Brf1 antibody. Immunoblot analysis (IB) was performed using antibodies against Brf1 or phosphoserine (p-Ser). (B) PTEN increases Bdp1 serine phosphorylation. Total protein was isolated from PTEN-inducible U87 cells (left) and LN18 cells (right), each treated as described above (A). Immunoprecipitation was performed using Bdp1 antibody (IP), followed by immunoblot analysis with antibodies against Bdp1 or phosphoserine (IB). Representative autoradiographs are shown. The change in association is calculated based on values from cells left untreated (0 h) or transfected with mmRNA, where indicated. (C) PTEN alters the phosphorylation states of Brf1 and Bdp1. PTEN-inducible U87 cells were treated with DOX for 0, 6, or 24 h. Prior to being harvested, cells were incubated with 32Pi (0.5 mCi/ml) for 3 h. The resultant cell lysates were immunoprecipitated with Brf1 (left) or Bdp1 (right) antibodies and subjected to sodium dodecyl sulfate-polyacrylamide gel electrophoresis. Autoradiography was used to examine the amount of 32P-incorporated Brf1 and Bdp1. All graphs represent determinations from at least three biologically independent samples (means ± SE).
FIG. 9.
PTEN expression selectively decreases the promoter occupancy of TFIIIB. ChIP analysis was performed with PTEN-inducible U87 cells that were treated with DOX for 0, 6, or 24 h using antibodies against TBP, Brf1, Bdp1, or TFIIIC102 and subjected to quantitative PCR with primers specific for the tRNALeu gene promoter. Each time point (0, 6, and 24 h) is normalized to its respective input. The change in occupancy is calculated based on values from untreated cells (0 h). Graphs represent determinations from at least three biologically independent samples (means ± SE).
Similar articles
- Phosphorylation of histone H3 serine 28 modulates RNA polymerase III-dependent transcription.
Zhang Q, Zhong Q, Evans AG, Levy D, Zhong S. Zhang Q, et al. Oncogene. 2011 Sep 15;30(37):3943-52. doi: 10.1038/onc.2011.105. Epub 2011 Apr 4. Oncogene. 2011. PMID: 21460852 Free PMC article. - PTEN represses RNA Polymerase I transcription by disrupting the SL1 complex.
Zhang C, Comai L, Johnson DL. Zhang C, et al. Mol Cell Biol. 2005 Aug;25(16):6899-911. doi: 10.1128/MCB.25.16.6899-6911.2005. Mol Cell Biol. 2005. PMID: 16055704 Free PMC article. - p53 represses RNA polymerase III transcription by targeting TBP and inhibiting promoter occupancy by TFIIIB.
Crighton D, Woiwode A, Zhang C, Mandavia N, Morton JP, Warnock LJ, Milner J, White RJ, Johnson DL. Crighton D, et al. EMBO J. 2003 Jun 2;22(11):2810-20. doi: 10.1093/emboj/cdg265. EMBO J. 2003. PMID: 12773395 Free PMC article. - RNA polymerase III transcription: its control by tumor suppressors and its deregulation by transforming agents.
Brown TR, Scott PH, Stein T, Winter AG, White RJ. Brown TR, et al. Gene Expr. 2000;9(1-2):15-28. doi: 10.3727/000000001783992713. Gene Expr. 2000. PMID: 11097422 Free PMC article. Review. - Regulation of tRNA synthesis by the general transcription factors of RNA polymerase III - TFIIIB and TFIIIC, and by the MAF1 protein.
Graczyk D, Cieśla M, Boguta M. Graczyk D, et al. Biochim Biophys Acta Gene Regul Mech. 2018 Apr;1861(4):320-329. doi: 10.1016/j.bbagrm.2018.01.011. Epub 2018 Feb 6. Biochim Biophys Acta Gene Regul Mech. 2018. PMID: 29378333 Review.
Cited by
- RNF12 catalyzes BRF1 ubiquitination and regulates RNA polymerase III-dependent transcription.
Wang F, Zhao K, Yu S, Xu A, Han W, Mei Y. Wang F, et al. J Biol Chem. 2019 Jan 4;294(1):130-141. doi: 10.1074/jbc.RA118.004524. Epub 2018 Nov 9. J Biol Chem. 2019. PMID: 30413534 Free PMC article. - Human tRNA genes function as chromatin insulators.
Raab JR, Chiu J, Zhu J, Katzman S, Kurukuti S, Wade PA, Haussler D, Kamakaka RT. Raab JR, et al. EMBO J. 2012 Jan 18;31(2):330-50. doi: 10.1038/emboj.2011.406. Epub 2011 Nov 15. EMBO J. 2012. PMID: 22085927 Free PMC article. - Abnormal expression of TFIIIB subunits and RNA Pol III genes is associated with hepatocellular carcinoma.
Lei J, Chen S, Zhong S. Lei J, et al. Liver Res. 2017 Sep;1(2):112-120. doi: 10.1016/j.livres.2017.08.005. Epub 2017 Sep 9. Liver Res. 2017. PMID: 29276645 Free PMC article. - Nutrient/TOR-dependent regulation of RNA polymerase III controls tissue and organismal growth in Drosophila.
Marshall L, Rideout EJ, Grewal SS. Marshall L, et al. EMBO J. 2012 Apr 18;31(8):1916-30. doi: 10.1038/emboj.2012.33. Epub 2012 Feb 24. EMBO J. 2012. PMID: 22367393 Free PMC article. - Down-regulation of the transcriptional mediator subunit Med1 contributes to the loss of expression of metastasis-associated dapk1 in human cancers and cancer cells.
Gade P, Singh AK, Roy SK, Reddy SP, Kalvakolanu DV. Gade P, et al. Int J Cancer. 2009 Oct 1;125(7):1566-74. doi: 10.1002/ijc.24493. Int J Cancer. 2009. PMID: 19521987 Free PMC article.
References
- Bilanges, B., and D. Stokoe. 2007. Mechanisms of translational deregulation in human tumors and therapeutic intervention strategies. Oncogene 265973-5990. - PubMed
- Borchert, G. M., W. Lanier, and B. L. Davidson. 2006. RNA polymerase III transcribes human microRNAs. Nat. Struct. Mol. Biol. 131097-1101. - PubMed
- Chen, W., W. Bocker, J. Brosius, and H. Tiedge. 1997. Expression of neural BC200 RNA in human tumours. J. Pathol. 183345-351. - PubMed
- Chen, W., J. Heierhorst, J. Brosius, and H. Tiedge. 1997. Expression of neural BC1 RNA: induction in murine tumours. Eur. J. Cancer 33288-292. - PubMed
- Chow, L. M. L., and S. J. Baker. 2006. PTEN function in normal and neoplastic growth. Cancer Lett. 241184-196. - PubMed
Publication types
MeSH terms
Substances
LinkOut - more resources
Full Text Sources
Research Materials
Miscellaneous
