Transglutaminase induces protofibril-like amyloid beta-protein assemblies that are protease-resistant and inhibit long-term potentiation - PubMed (original) (raw)
Transglutaminase induces protofibril-like amyloid beta-protein assemblies that are protease-resistant and inhibit long-term potentiation
Dean M Hartley et al. J Biol Chem. 2008.
Abstract
An increasing body of evidence suggests that soluble assemblies of amyloid beta-protein (Abeta) play an important role in the initiation of Alzheimer disease (AD). In vitro studies have found that synthetic Abeta can form soluble aggregates through self-assembly, but this process requires Abeta concentrations 100- to 1000-fold greater than physiological levels. Tissue transglutaminase (TGase) has been implicated in neurodegeneration and can cross-link Abeta. Here we show that TGase induces rapid aggregation of Abeta within 0.5-30 min, which was not observed with chemical cross-linkers. Both Abeta40 and Abeta42 are good substrates for TGase but show different aggregation patterns. Guinea pig and human TGase induced similar Abeta aggregation patterns, and oligomerization was observed with Abeta40 concentrations as low as 50 nm. The formed Abeta40 species range from 5 to 6 nm spheres to curvilinear structures of the same width, but up to 100 nm in length, that resemble the previously described self-assembled Abeta protofibrils. TGase-induced Abeta40 assemblies are resistant to a 1-h incubation with either neprilysin or insulin degrading enzyme, whereas the monomer is rapidly degraded by both proteases. In support of these species being pathological, TGase-induced Abeta40 assemblies (100 nm) inhibited long term potentiation recorded in the CA1 region of mouse hippocampus slices. Our data suggest that TGase can contribute to AD by initiating Abeta oligomerization and aggregation at physiological levels, by reducing the clearance of Abeta due to the generation of protease-resistant Abeta species, and by forming Abeta assemblies that inhibit processes involved in memory and learning. Our data suggest that TGase might constitute a specific therapeutic target for slowing or blocking the progression of AD.
Figures
FIGURE 1.
TGase induces Aβ aggregation in a time- and calcium-dependent manner. A, the Western blot analysis shows the time dependence of Aβ40 (25 μ
m
) aggregation induced by TGase at room temperature and stopped with EDTA. In the “_EDTA_” sample, the chelator was added before TGase.B, densitometry of Western blots such as the one in panel A shows that TGase induces rapid aggregation of Aβ. For the quantification of the immunoblot, the total signal due to oligomerization (>4 kDa) in each lane was measured and normalized to the signal at T = 0, which was given a value of 1. Each data point represents the mean of three separate experiments (±S.E.). C, a Superdex 75 size exclusion column was used to show the conversion from substrate (low molecular weight Aβ) to product (aggregated Aβ) induced by TGase addition. Aβ40 alone showed little conversion of LWM Aβ (31-min peak) (solid line), whereas in the sample containing TGase the majority of Aβ was converted into aggregates (19-min peak) (dotted line). D, the TGase inhibitor LDDN-80042 was highly effective in attenuating the aggregation of Aβ40, blocking aggregation at concentrations ranging from 0.1 to 10 μ
m
. The “_No TGase_” sample was run under identical conditions, but without TGase. E, densitometry of Western blots such as the one in panel D shows TGase inhibition with LDDN-80042. For this analysis, the signal from the bands at 8 kDa and higher were measured and normalized against the signal from the same area measured in the sample lacking TGase, which was given a value of 1 (n = 3, ±S.E.). F, a mutant Aβ40 peptide (i.e. Aβ40 with its two lysines mutated to alanine = mut) did not form aggregates in the presence of TGase (lane 1, Aβ40 + TGase;lane 2, Aβ40 only; lane 3, mutant Aβ40 + TGase;lane 4, mutant Aβ40 only). The asterisk indicates Aβ40 bound to TGase.
FIGURE 2.
Chemical versus enzymatic aggregation of Aβ.A, glyceraldehyde-3-phosphate dehydrogenase (G3PD), aldolase (Aldo), and Aβ40 were treated with the chemical cross-linking reagent DMS or TGase and compared with untreated samples. All samples were incubated at 30 °C overnight, separated by SDS-PAGE, and stained with the protein dye, SYRPO Red. G3PD and Aldo could be readily cross-linked with DMS (lanes 2 and 4) but not with TGase (lanes 8 and_10_). Conversely, Aβ was not cross-linked by DMS (lane 6) but formed aggregates in the presence of TGase (lane 12).B and C, the specificity of Aβ cross-linking was also assessed by SEC separation (Superdex 75 column, 2
m
guanidine + 10 m
m
NaCl). Aβ treated with DMS showed no aggregation, as seen in lane 6 of panel A. This material thus produced predominantly a monomeric peak at 27 min (B). Aβ aggregation occurred in the presence of TGase, as seen in lane 12 of panel A. The SEC elution profile shows the transition from monomeric Aβ (27 min) to oligomeric Aβ (peaks at 24 min or earlier) (C). SDS-PAGE gels and SEC chromatograms show a single experiment but are representative of three separate experiments.
FIGURE 3.
Aggregation of Aβ40 induced by guinea pig and human TGase. To directly compare the enzymatic activity of guinea pig and human TGase, the amount of catalytic sites in the two preparations was plotted against the substrate conversion as measured by densitometry of the Western blots (data not shown). The results showed that the two enzymes catalyze reactions with very similar kinetics (n = 3, ±S.E.).
FIGURE 4.
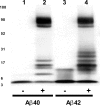
Both Aβ40 and Aβ42 are substrates for TGase. Aβ40 and Aβ42 were compared for their potential to serve as substrate for TGase. Aβ40 and Aβ42 were initially denatured in guanidine HCl and purified by SEC before the addition of TGase. Aβ40 and Aβ42 samples (7.5 μ
m
each) incubated without TGase are shown in lanes 1 and 3, respectively, whereas Aβ40 and Aβ42 incubated with TGase are shown in lanes 2 and 4. The Western blot shown is representative of three separate experiments.
FIGURE 5.
TGase lowers the concentration of Aβ needed for aggregation. A, lanes 1 and 2 show control experiments containing either only Aβ40 or only TGase, respectively. Incubation of 0.5 μ
m
(lane 3) or 1 μ
m
(lane 4) Aβ with TGase caused aggregation. B, reactions were performed (24 h at room temperature) with an Aβ40 concentration of 50 n
m
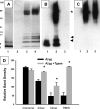
without (lane 1) or with (lane 2) TGase (1.1 × 10⁻³ units/ml) and then stopped with EDTA and concentrated 1000-fold. In the presence of TGase, bands were observed at 8 and 12 kDa, indicating the formation of Aβ oligomers (lane 2, arrows). In the “_A_β only_” sample (lane 1), the 12-kDa band was absent and the 8-kDa band was much less prominent. No bands were observed with the “_TGase only_” sample (lane 3). C, the same reaction as in B probed with an anti-TGase antibody revealed a large smear (lane 2, asterisk) similar to the heavy material seen in the immunoblot probed for Aβ (panel B, lane 2, asterisk). The sample in lane 1 contains only Aβ and no TGase. Western blots are from a single experiment and are representative of a set of three to four separate experiments. D, Western blots (n = 3) as the one shown in panel B were quantified by densitometry. *, statistical significance at the_p < 0.05 level using a paired t test comparing specific molecular weight bands in the Aβ + TGase sample with the corresponding bands in the Aβ only sample.
FIGURE 6.
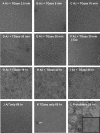
TGase-induced aggregation produces defined Aβassemblies. Aβ40 was denatured with guanidine HCl, purified by SEC, incubated with TGase for 2.5 min to 68 h, and imaged by EM. No structures were observed at 2.5 or 5 min (A and B), but spherical structures became visible between 10 and 20 min (C and_D_). These particles became more elongated by 30 min (E) and grew further in length with time (G-I). In contrast, no structures were observed at 68 h with Aβ40 only (J) or TGase only (K) samples (except for an occasional 12 nm structure, presumably representing aggregates of TGase). The formation of the observed structures required TGase, because removal of calcium prevented their formation (F). TGase-induced Aβ assemblies are very similar to Aβ protofibrils formed by self-aggregation (500 μ
m
, 68 h) (L and inset). Images are from a single time course experiment. The experiment was repeated three times resulting in identical Aβ structures, but the time when Aβ structures appeared varied between experiments as previously observed in the Western blot experiments.Scale bars represent 50 nm.
FIGURE 7.
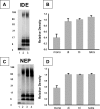
TGase-induced Aβ aggregates are resistant to the proteases insulin degrading enzyme (IDE) and neprilysin (NEP). A, Aβ was incubated with TGase, and the reaction was stopped with the TGase inhibitor LDDN-80042. Aβ aggregation did not occur when the TGase inhibitor was added at the beginning of the reaction (lane 1). TGase-treated Aβ samples were incubated without (lane 2) or with IDE (50 n
m
) (lane 3) showing little degradation of the oligomeric bands (>6 kDa). In contrast, monomeric Aβ (∼4 kDa) remaining in the TGase-treated samples was susceptible to degradation by IDE (lane 3). B, quantitative analysis of the Western blots by densitometry showed a degradation of the monomer (mono) and no degradation of the oligomeric species. Each individual band in the IDE-treated sample (lane 3) was normalized to the signal of the corresponding band in the Aβ40 + TGase sample without IDE (lane 2). The bands in lane 2 (no IDE) were given a value of 1. Each_bar_ in the graph represents the mean of four or five individual experiments (±S.E.). C, NEP also degraded monomeric, but not oligomeric Aβ.No aggregation was observed if the inhibitor was added prior to TGase being added to Aβ (lane 1). NEP (38 and 76 n
m
) was added to TGase-treated Aβ (lanes 3 and 4, respectively) and showed degradation of monomeric, but not the oligomeric Aβ species (6 > kDa). D, by densitometry, a decrease in monomeric Aβ (∼4 kDa) was observed in the presence of 76 n
m
NEP, whereas the 8-, 12-, and 16-kDa bands were not affected.Bars represent the mean of three individual experiments (±S.E.).
FIGURE 8.
TGase-treated Aβ inhibits LTP in the CA1 region of the hippocampus. Aβ40 was incubated with or without TGase, and the reaction was stopped with the TGase inhibitor LDDN-80042. Aβ was diluted to 100 n
m
in ACSF, circulated over the slice for 30 min, and replaced with fresh ACSF containing no Aβ before tetanus. A, traces show typical fEPSPs elicited 5 min before (black trace) and 40 min after (light gray trace) high frequency stimulation (horizontal calibration line = 10 ms; vertical line = 0.5 mV). B, graph shows the plotting of the slope of the fEPSP for an individual experiment. High frequency stimulation (arrow) was used to induce LTP in hippocampal slices. The recorded fEPSP slope was plotted for three groups, ACSF only (black solid boxes), Aβ only (open circles), and Aβ + TGase (light gray solid triangles).C, data were summarized and graphed for LTP magnitudes from the three groups in part B. Data were pooled from slices of the same treatment group, and are presented as the mean ± S.E. (n = 14-15). Values expressed here represent 60-min time points after the conditioning stimulus. The Aβ + TGase condition was found to be statistically different from either the ACSF or Aβ treatment groups (*,p < 0.001, analysis of variance/Newman-Keuls post-hoc test).D, electron micrographs of untreated Aβ (left image) and TGase-treated Aβ (right image) show protofibril-like structures in the TGase-treated Aβ sample that inhibited LTP (bar = 100 nm).
Similar articles
- Tissue transglutaminase-mediated glutamine deamidation of beta-amyloid peptide increases peptide solubility, whereas enzymatic cross-linking and peptide fragmentation may serve as molecular triggers for rapid peptide aggregation.
Schmid AW, Condemi E, Tuchscherer G, Chiappe D, Mutter M, Vogel H, Moniatte M, Tsybin YO. Schmid AW, et al. J Biol Chem. 2011 Apr 8;286(14):12172-88. doi: 10.1074/jbc.M110.176149. Epub 2011 Feb 7. J Biol Chem. 2011. PMID: 21300794 Free PMC article. - Interaction between tissue transglutaminase and amyloid-beta: Protein-protein binding versus enzymatic crosslinking.
Wilhelmus MMM, Jongenelen CA, Bol JGJM, Drukarch B. Wilhelmus MMM, et al. Anal Biochem. 2020 Mar 1;592:113578. doi: 10.1016/j.ab.2020.113578. Epub 2020 Jan 8. Anal Biochem. 2020. PMID: 31923381 - Tissue Transglutaminase and Its Product Isopeptide Are Increased in Alzheimer's Disease and APPswe/PS1dE9 Double Transgenic Mice Brains.
Zhang J, Wang S, Huang W, Bennett DA, Dickson DW, Wang D, Wang R. Zhang J, et al. Mol Neurobiol. 2016 Oct;53(8):5066-78. doi: 10.1007/s12035-015-9413-x. Epub 2015 Sep 19. Mol Neurobiol. 2016. PMID: 26386840 Free PMC article. - Amyloid beta-degrading cryptidases: insulin degrading enzyme, presequence peptidase, and neprilysin.
Malito E, Hulse RE, Tang WJ. Malito E, et al. Cell Mol Life Sci. 2008 Aug;65(16):2574-85. doi: 10.1007/s00018-008-8112-4. Cell Mol Life Sci. 2008. PMID: 18470479 Free PMC article. Review. - Peptidases, proteases and amyloid beta-peptide catabolism.
Hersh LB. Hersh LB. Curr Pharm Des. 2003;9(6):449-54. doi: 10.2174/1381612033391676. Curr Pharm Des. 2003. PMID: 12570808 Review.
Cited by
- Cross-species genetic screens identify transglutaminase 5 as a regulator of polyglutamine-expanded ataxin-1.
Lee WS, Al-Ramahi I, Jeong HH, Jang Y, Lin T, Adamski CJ, Lavery LA, Rath S, Richman R, Bondar VV, Alcala E, Revelli JP, Orr HT, Liu Z, Botas J, Zoghbi HY. Lee WS, et al. J Clin Invest. 2022 May 2;132(9):e156616. doi: 10.1172/JCI156616. J Clin Invest. 2022. PMID: 35499073 Free PMC article. - The Transglutaminase-2 Interactome in the APP23 Mouse Model of Alzheimer's Disease.
Wilhelmus MMM, Tonoli E, Coveney C, Boocock DJ, Jongenelen CAM, Brevé JJP, Verderio EAM, Drukarch B. Wilhelmus MMM, et al. Cells. 2022 Jan 24;11(3):389. doi: 10.3390/cells11030389. Cells. 2022. PMID: 35159198 Free PMC article. - Absence of tissue transglutaminase reduces amyloid-beta pathology in APP23 mice.
Wilhelmus MMM, Chouchane O, Loos M, Jongenelen CAM, Brevé JJP, Jonker A, Bol JGJM, Smit AB, Drukarch B. Wilhelmus MMM, et al. Neuropathol Appl Neurobiol. 2022 Jun;48(4):e12796. doi: 10.1111/nan.12796. Epub 2022 Feb 23. Neuropathol Appl Neurobiol. 2022. PMID: 35141929 Free PMC article. - A Disulfide-Stabilized Aβ that Forms Dimers but Does Not Form Fibrils.
Zhang S, Yoo S, Snyder DT, Katz BB, Henrickson A, Demeler B, Wysocki VH, Kreutzer AG, Nowick JS. Zhang S, et al. Biochemistry. 2022 Feb 15;61(4):252-264. doi: 10.1021/acs.biochem.1c00739. Epub 2022 Jan 26. Biochemistry. 2022. PMID: 35080857 Free PMC article. - Extracellular GAPDH Promotes Alzheimer Disease Progression by Enhancing Amyloid-β Aggregation and Cytotoxicity.
Lazarev VF, Tsolaki M, Mikhaylova ER, Benken KA, Shevtsov MA, Nikotina AD, Lechpammer M, Mitkevich VA, Makarov AA, Moskalev AA, Kozin SA, Margulis BA, Guzhova IV, Nudler E. Lazarev VF, et al. Aging Dis. 2021 Aug 1;12(5):1223-1237. doi: 10.14336/AD.2020.1230. eCollection 2021 Aug. Aging Dis. 2021. PMID: 34341704 Free PMC article.
References
- Jarrett, J. T., Berger, E. P., and Lansbury, P. T., Jr. (1993) Biochemistry 32 4693-4697 - PubMed
- Harper, J. D., and Lansbury, P. T. (1997) Annu. Rev. Biochem. 66 385-407 - PubMed
- Fagan, A. M., Mintun, M. A., Mach, R. H., Lee, S. Y., Dence, C. S., Shah, A. R., LaRossa, G. N., Spinner, M. L., Klunk, W. E., Mathis, C. A., DeKosky, S. T., Morris, J. C., and Holtzman, D. M. (2006) Ann. Neurol. 59 512-519 - PubMed
- Nitsch, R. M., Rebeck, G. W., Deng, M., Richardson, U. I., Tennis, M., Schenk, D. B., Vigo-Pelfrey, C., Lieberburg, I., Wurtman, R. J., Hyman, B. T., et al. (1995) Ann. Neurol. 37 512-518 - PubMed
Publication types
MeSH terms
Substances
LinkOut - more resources
Full Text Sources
Other Literature Sources
Miscellaneous


