Neprilysin: an enzyme candidate to slow the progression of Alzheimer's disease - PubMed (original) (raw)
Neprilysin: an enzyme candidate to slow the progression of Alzheimer's disease
Salim S El-Amouri et al. Am J Pathol. 2008 May.
Abstract
It is well established that the extracellular deposition of amyloid beta (Abeta) peptide plays a central role in the development of Alzheimer's disease (AD). Therefore, either preventing the accumulation of Abeta peptide in the brain or accelerating its clearance may slow the rate of AD onset. Neprilysin (NEP) is the dominant Abeta peptide-degrading enzyme in the brain; NEP becomes inactivated and down-regulated during both the early stages of AD and aging. In this study, we investigated the effect of human (h)NEP gene transfer to the brain in a mouse model of AD before the development of amyloid plaques, and assessed how this treatment modality affected the accumulation of Abeta peptide and associated pathogenetic changes (eg, inflammation, oxidative stress, and memory impairment). Overexpression of hNEP for 4 months in young APP/DeltaPS1 double-transgenic mice resulted in reduction in Abeta peptide levels, attenuation of amyloid load, oxidative stress, and inflammation, and improved spatial orientation. Moreover, the overall reduction in amyloidosis and associated pathogenetic changes in the brain resulted in decreased memory impairment by approximately 50%. These data suggest that restoring NEP levels in the brain at the early stages of AD is an effective strategy to prevent or attenuate disease progression.
Figures
Figure 1
Amyloid plaque deposition in the brain of 3-month-old APP/ΔPS1-Tg mice. Brain sections of 3-month-old APP/ΔPS1-Tg mice were immunostained with anti-Aβ peptide antibody (10D5) to detect the amyloid plaque deposition. A: Right brain hemisphere was examined in different areas and under increasing magnification (B–D) (black, blue, and red boxes) as indicated in the figure. Arrows point to the amyloid plaques in the cortex.
Figure 2
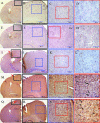
Expression of GFP and hNEP in the brain 4 months after viral injection of 3-month-old APP/ΔPS1-Tg mice. A–H: Right brain hemisphere sections (30 μm) of nontreated 8-month-old APP/ΔPS1-Tg mice were IHC stained with antibodies against GFP (A–D) or hNEP (E–H). I–L: Sections of right brain hemisphere (around the injection site, red arrow) obtained from mice overexpressing GFP were immunostained with anti-hNEP antibody as a negative control. M–P: Sections of right brain hemisphere obtained from mice overexpressing GFP were immunostained with anti-GFP antibodies to detect GFP expression. Q–T: Sections of right brain hemisphere obtained from mice overexpressing hNEP were immunostained with anti-hNEP antibody to detect hNEP expression. A, E, I, M, and Q were examined at different magnification (black, blue, and red boxes) as indicated. Black arrows show examples of GFP (P)- and hNEP (T)-positive neurons.
Figure 3
NEP expression in lentiviral injected animals. A: Western blot analysis was performed on brain tissue from mice injected with Lenti-hNEP (hNEP) or Lenti-GFP (GFP). Three hundred mg of brain tissue (around the injection site) was homogenized and 20 μg of protein homogenates were immunoblotted with CD-10 antibody (1:100 dilution, Novocastra). Mice injected with Lenti-hNEP show an increase in NEP expression compared to Lenti-GFP mice. Black arrow indicates the ∼110-kDa band of hNEP protein on Western blot. B: Densitometry measurements of developed NEP bands on Western blots were made using NIH image software (ImageJ1.36b) and assigned as arbitrary integrated density values (IDV) (*P = 0.0222).
Figure 4
Level of amyloid load after 4 months of overexpressing GFP or hNEP in APP/ΔPS1-Tg mouse brains. Right brain hemisphere sections obtained from mice injected with Lenti-GFP (A) or Lenti-hNEP (B) vectors were immunostained with mouse anti-human Aβ peptide (clone 10D5) antibody to detect amyloid plaques. The number of amyloid plaques in the brain sections (10 sections per mouse) from each set of mice injected with Lenti-GFP or Lenti-hNEP vectors were counted and averaged (C). The left-brain hemisphere was examined for guanidine-extractable Aβ1-40 (D), and Aβ1-42 peptides (E). Tg-control: 7-month-old APP/ΔPS1-Tg mice that were not injected with either lentiviral vectors (Lenti-hNEP or Lenti-GFP) were used as controls (*P < 0.0008, **P < 0.0001, ***P = 0.0064).
Figure 5
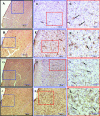
Density of activated microglia and astrocytes in APP/ΔPS1-Tg mouse brain after 4 months of Lenti-GFP or -hNEP vector injection. A–F: Brain sections from APP/ΔPS1-Tg mice overexpressing hNEP (A–C) or GFP (D–F) were immunostained with anti-mouse CD68 antibody to detect the distribution of activated microglial cells. G–L: Brain sections of APP/ΔPS1-Tg mice overexpressing hNEP (G–I) or GFP (J–L) were immunostained with anti-mouse GFAP antibody to detect the distribution of activated astrocytes. The figures (A, D, G, and J) were examined at different magnification (blue and red boxes) as indicated. Black arrows in C and F show examples of CD68-activated microglia, whereas in I and L they indicate activated GFAP-positive astrocytes.
Figure 6
Density of Iba-1-positive microglial cells in APP/ΔPS1-Tg mouse brains after 4 months of Lenti-GFP or -hNEP vectors injection. A: Right brain hemisphere sections of APP/ΔPS1-Tg mice overexpressing GFP (A–F) or hNEP (G–L) were immunostained with anti-mouse Iba-1 antibody (dilution 1:500; Wako Chemicals, Richmond, VA) to detect the distribution of activated microglial cells. The figures (B--F) and (H–L) represent an examination of A and J, respectively, at different parts and different magnification (black, blue, red, green, and yellow boxes) as indicated. Black arrows show examples of Iba-1-positive microglia.
Figure 7
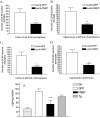
Quantitative analysis of activated microglia, astrocytes, and IL-6 in the brain of APP/ΔPS1-Tg mice after 4 months of hNEP or GFP overexpression. Brain sections from APP/ΔPS1-Tg mice overexpressing GFP or hNEP were stained with anti-mouse CD68 antibody to detect the activated microglial cells. Five sections of each mouse (around the injection site) were counted and averaged for the number of CD68-activated microglia in the cortex (A) and hippocampus (B) (*P = 0.0232, **P = 0.0066). C and D: Brain sections from APP/ΔPS1-Tg mice overexpressing GFP or hNEP were immunostained with anti-mouse GFAP antibody to detect the activated astrocytes. Five sections of each mouse (around the injection site) were counted and averaged for the number of GFAP-activated astrocytes in the cortex (A) and hippocampus (B) (#P = 0.0093, Ω_P_ = 0.0016). E: Homogenized extracts from left brain hemispheres obtained from wild-type (C57BL/6) mice (Wt), nontreated APP/ΔPS1-Tg mice (7 months old) (Tg), and APP/ΔPS1-Tg mice overexpressing hNEP (hNEP), or GFP (GFP) were tested for IL-6 levels by the IL-6 ELISA kit (***P = 0.0017).
Figure 8
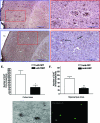
Oxidative stress assessment in the brain of APP/ΔPS1-Tg mice after 4 months of viral injection. Brain sections from APP/ΔPS1-Tg mice overexpressing GFP (A and B) or hNEP (C and D) were immunostained with anti-3-NT antibody. A and C were examined under different magnification (B and D) (red boxes) as indicated. Arrows indicate the 3-NT immunoreactivity, whereas white circles represent 3-NT immunoreactivity around the amyloid plaques. E and F: Five sections of each mouse (around the injection site) were counted and averaged for the number of 3-NT immunoreactivity in the cortex (E) and hippocampus (F) (*P = 0.0229, **P = 0.0092). G and H: Co-localization of amyloid plaques and 3-NT, brain sections of APP/ΔPS1-Tg mice overexpressing GFP, were immunostained with anti-3NT antibody (G), and double stained with the fluorescent amyloid stain thioflavin-S (H).
Figure 9
Carbonyl protein content in the brain of APP/ΔPS1-Tg mice overexpressing hNEP and control. A: Extracts of left brain hemisphere obtained from mice overexpressing GFP (lanes 1 and 2), hNEP (lanes 3 and 4), as well as noninjected APP/ΔPS1-Tg mice of the same age (Tg-control) (lanes 5 and 6) were analyzed for the level of oxidized proteins by Oxyblot and Western blot assays. B: Protein concentrations of samples used in A were run under similar conditions on sodium dodecyl sulfate-polyacrylamide gel electrophoresis and identified by Coomassie blue staining to control for loading differences between samples. C: Densitometry measurements of development of oxidized protein bands on Western blots were made using NIH image software (ImageJ 1.36b) and assigned as arbitrary integrated density values (IDV) (*P = 0.0390 compared to Lenti-GFP or Tg-control IDV).
Figure 10
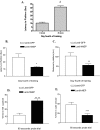
Morris water maze analysis. A: Memory impairment comparison of APP/ΔPS1-Tg mice at 3 and 8 months (mon) of age (#P < 0.001). B and C: Each group of mice overexpressing hNEP (Lenti-hNEP) or GFP (Lenti-GFP) were tested on the 4th day of training for spatial learning (B and C) and memory retention (D and E). To test the mice for spatial learning, the escape latency (B), and total distance (C) taken by both groups of mice to reach the hidden platform were measured. To test for memory impairment (working memory retention), both groups of mice were tested for the percentage of time spend in the NE quadrant (D) and the percentage of time spent in the outer annular (around the wall of the tank) (E) after the hidden platform was removed (*P = 0.0031, **P = 0.0077, ***P = 0.0013, ****P < 0.0001). Morris water maze analysis was accomplished by the SMART video tracking system.
Similar articles
- Neprilysin deficiency alters the neuropathological and behavioral phenotype in the 5XFAD mouse model of Alzheimer's disease.
Hüttenrauch M, Baches S, Gerth J, Bayer TA, Weggen S, Wirths O. Hüttenrauch M, et al. J Alzheimers Dis. 2015;44(4):1291-302. doi: 10.3233/JAD-142463. J Alzheimers Dis. 2015. PMID: 25408216 - Long-term neprilysin gene transfer is associated with reduced levels of intracellular Abeta and behavioral improvement in APP transgenic mice.
Spencer B, Marr RA, Rockenstein E, Crews L, Adame A, Potkar R, Patrick C, Gage FH, Verma IM, Masliah E. Spencer B, et al. BMC Neurosci. 2008 Nov 12;9:109. doi: 10.1186/1471-2202-9-109. BMC Neurosci. 2008. PMID: 19014502 Free PMC article. - Neprilysin gene transfer reduces human amyloid pathology in transgenic mice.
Marr RA, Rockenstein E, Mukherjee A, Kindy MS, Hersh LB, Gage FH, Verma IM, Masliah E. Marr RA, et al. J Neurosci. 2003 Mar 15;23(6):1992-6. doi: 10.1523/JNEUROSCI.23-06-01992.2003. J Neurosci. 2003. PMID: 12657655 Free PMC article. - [Elucidating Pathogenic Mechanisms of Early-onset Alzheimer's Disease in Down Syndrome Patients].
Asai M, Kawakubo T, Mori R, Iwata N. Asai M, et al. Yakugaku Zasshi. 2017;137(7):801-805. doi: 10.1248/yakushi.16-00236-2. Yakugaku Zasshi. 2017. PMID: 28674290 Review. Japanese. - Aβ-degrading enzymes: potential for treatment of Alzheimer disease.
Miners JS, Barua N, Kehoe PG, Gill S, Love S. Miners JS, et al. J Neuropathol Exp Neurol. 2011 Nov;70(11):944-59. doi: 10.1097/NEN.0b013e3182345e46. J Neuropathol Exp Neurol. 2011. PMID: 22002425 Review.
Cited by
- Mercury Reduces the Enzymatic Activity of Neprilysin in Differentiated SH-SY5Y Cells.
Chin-Chan M, Segovia J, Quintanar L, Arcos-López T, Hersh LB, Chow KM, Rodgers DW, Quintanilla-Vega B. Chin-Chan M, et al. Toxicol Sci. 2015 May;145(1):128-37. doi: 10.1093/toxsci/kfv037. Epub 2015 Feb 10. Toxicol Sci. 2015. PMID: 25673500 Free PMC article. - Nucleic acid drug vectors for diagnosis and treatment of brain diseases.
Lu ZG, Shen J, Yang J, Wang JW, Zhao RC, Zhang TL, Guo J, Zhang X. Lu ZG, et al. Signal Transduct Target Ther. 2023 Jan 17;8(1):39. doi: 10.1038/s41392-022-01298-z. Signal Transduct Target Ther. 2023. PMID: 36650130 Free PMC article. Review. - Role of neprilysin in airway inflammation induced by diesel exhaust emissions.
Wong SS, Sun NN, Fastje CD, Witten ML, Lantz RC, Lu B, Sherrill DL, Gerard CJ, Burgess JL; HEI Health Review Committee. Wong SS, et al. Res Rep Health Eff Inst. 2011 Jun;(159):3-40. Res Rep Health Eff Inst. 2011. PMID: 21877416 Free PMC article. - Environmental Enrichment as a Positive Behavioral Intervention Across the Lifespan.
Sampedro-Piquero P, Begega A. Sampedro-Piquero P, et al. Curr Neuropharmacol. 2017;15(4):459-470. doi: 10.2174/1570159X14666160325115909. Curr Neuropharmacol. 2017. PMID: 27012955 Free PMC article. Review. - N-terminal domain of Bothrops asper Myotoxin II Enhances the Activity of Endothelin Converting Enzyme-1 and Neprilysin.
Smith AI, Rajapakse NW, Kleifeld O, Lomonte B, Sikanyika NL, Spicer AJ, Hodgson WC, Conroy PJ, Small DH, Kaye DM, Parkington HC, Whisstock JC, Kuruppu S. Smith AI, et al. Sci Rep. 2016 Mar 2;6:22413. doi: 10.1038/srep22413. Sci Rep. 2016. PMID: 26931059 Free PMC article.
References
- Khachaturian ZS. Diagnosis of Alzheimer’s disease. Arch Neurol. 1985;42:1097–1105. - PubMed
- Braak H, Braak E. Morphological criteria for the recognition of Alzheimer’s disease and the distribution pattern of cortical changes related to this disorder. Neurobiol Aging. 1994;3:355–380. - PubMed
- Selkoe DJ. Alzheimer’s disease: genes, proteins, and therapy. Physiol Rev. 2001;81:741–766. - PubMed
- Selkoe DJ. Alzheimer’s disease is a synaptic failure. Science. 2002;298:789–791. - PubMed
- Iwata N, Tsubuki S, Takaki Y, Watanabe K, Sekiguchi M, Hosoki E, Kawashima-Morishima M, Lee H-J, Hama E, Sekine-Aizawa Y, Saido TC. Identification of the major Aβ1-42-degrading catabolic pathway in brain parenchyma: suppression leads to biochemical and pathological deposition. Nat Med. 2000;6:143–150. - PubMed
Publication types
MeSH terms
Substances
LinkOut - more resources
Full Text Sources
Other Literature Sources
Medical
Molecular Biology Databases

