The SIRT1 deacetylase suppresses intestinal tumorigenesis and colon cancer growth - PubMed (original) (raw)
. 2008 Apr 16;3(4):e2020.
doi: 10.1371/journal.pone.0002020.
Gil Blander, Shaday Michan, Philipp Oberdoerffer, Shuji Ogino, Jennifer Campbell, Anupama Bhimavarapu, Sandra Luikenhuis, Rafael de Cabo, Charles Fuchs, William C Hahn, Leonard P Guarente, David A Sinclair
Affiliations
- PMID: 18414679
- PMCID: PMC2289879
- DOI: 10.1371/journal.pone.0002020
The SIRT1 deacetylase suppresses intestinal tumorigenesis and colon cancer growth
Ron Firestein et al. PLoS One. 2008.
Erratum in
- Correction: The SIRT1 Deacetylase Suppresses Intestinal Tumorigenesis and Colon Cancer Growth.
Firestein R, Blander G, Michan S, Oberdoerffer P, Ogino S, Campbell J, Bhimavarapu A, Luikenhuis S, de Cabo R, Fuchs C, Hahn WC, Guarente LP, Sinclair DA. Firestein R, et al. PLoS One. 2024 Jun 6;19(6):e0305277. doi: 10.1371/journal.pone.0305277. eCollection 2024. PLoS One. 2024. PMID: 38843127 Free PMC article.
Abstract
Numerous longevity genes have been discovered in model organisms and altering their function results in prolonged lifespan. In mammals, some have speculated that any health benefits derived from manipulating these same pathways might be offset by increased cancer risk on account of their propensity to boost cell survival. The Sir2/SIRT1 family of NAD(+)-dependent deacetylases is proposed to underlie the health benefits of calorie restriction (CR), a diet that broadly suppresses cancer in mammals. Here we show that CR induces a two-fold increase SIRT1 expression in the intestine of rodents and that ectopic induction of SIRT1 in a beta-catenin-driven mouse model of colon cancer significantly reduces tumor formation, proliferation, and animal morbidity in the absence of CR. We show that SIRT1 deacetylates beta-catenin and suppresses its ability to activate transcription and drive cell proliferation. Moreover, SIRT1 promotes cytoplasmic localization of the otherwise nuclear-localized oncogenic form of beta-catenin. Consistent with this, a significant inverse correlation was found between the presence of nuclear SIRT1 and the oncogenic form of beta-catenin in 81 human colon tumor specimens analyzed. Taken together, these observations show that SIRT1 suppresses intestinal tumor formation in vivo and raise the prospect that therapies targeting SIRT1 may be of clinical use in beta-catenin-driven malignancies.
Conflict of interest statement
Competing Interests: Leonard Guarente and David Sinclair are consultants to Sirtris Pharmaceuticals. William Hahn is a consultant to Novartis Pharmaceuticals.
Figures
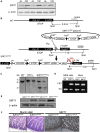
Figure 1. Generation of the conditional SIRT1 transgenic mice that mimic calorie restriction induced SIRT1 overexpression.
(A) Western blot analysis showing expression levels in the gut epithelium of SIRT1 in ad libitum-fed (AL) or calorie restricted (CR) rats. β-actin served as the loading control in all lanes. (B) Schematic representation of the strategy used for the generation of the floxed SIRT1 mouse embryonic stem (MES) cells. SIRT1 was cloned downstream of a constitutive CAGGS promoter followed by a transcriptional loxP-STOP-loxP cassette. This construct was specifically targeted in the 3′ UTR of the collagen A1 locus (ColA1) of mouse embryonic stem cells (MES) cells by FLP recombination. The targeted MES cells were injected into blastocysts. Red arrows indicate location of the SIRT1-Tg genotyping primers. (C) Southern blot showing the confirmation of the SIRT1STOP single integration into the Col1A locus of MES cells. (D) PCR confirming the germline transmission of the SIRT1STOP transgene to the chimaeras' offspring. (E) Western blot showing the levels of SIRT1 in the triple transgenic mice overexpressing SIRT1 (SIRT1ΔSTOP) and controls (SIRT1STOP). β-actin served as the loading control in all lanes. (F) Mucin stain and immunohistochemistry of SIRT1 in the small intestine of experimental (SIRT1ΔSTOP) and controls (SIRT1STOP) animals.
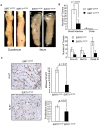
Figure 2. Effect of SIRT1 overexpression on intestinal tumor formation and proliferation in Apcmin/+ mice.
(A) Pictures of whole duodenal and ileal sections show gross intestinal tumors in mice overexpressing SIRT1 (SIRT1ΔSTOP) and controls (SIRT1STOP). Solid line indicates gastro-duodenal junction. Arrows indicate adenomas. White bar denotes 1 mm scale. (B) Average number of tumors according to intestinal location in SIRT1STOP control (n = 8) and SIRT1ΔSTOP experimental mice (n = 11). (C) Ki-67 staining of adenomas and proliferation rates. Pictures show Ki-67 immunohistochemical staining of adenomas from SIRT1STOP and SIRT1ΔSTOP. Proliferation index is expressed as the percent of Ki-67 stained adenoma cells (averaged for at least 10 adenomas per cohort). Mitotic rate is calculated as the number of histologically identifiable mitotic figures per 10 high-power fields (400×). Values in B and C are means±s.d.
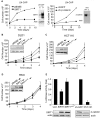
Figure 3. SIRT1 inhibits β-catenin driven cell proliferation and transcriptional activity.
(A–D) Stable LN-CAP, DLD1, HCT116 and RKO cell lines expressing the indicated product were seeded and cell number was monitored at different time points. Western blot were performed with SIRT1, actin or β-catenin antibodies. (E) DLD1 stable cell lines expressing Topflash-LuciferasePEST were infected with the indicated constructs. Cells were analyzed by western blot with antibodies against SIRT1 and β-catenin. Luciferase activity was normalized for total sample protein and represents three independent experiments done in quadruplicate.
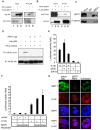
Figure 4. SIRT1 represses β-catenin transcriptional activity by directly interacting with and deacetylating β-catenin.
(A) Human 293T cells were transiently transfected with HA-S33Y-β-catenin in combination with either FLAG-tagged SIRT1 or vector control. Aliquots of total protein were subjected to immunoprecipitation with anti-FLAG antibody (IP FLAG). Immunoprecipitated proteins were immunoblotted with anti-HA (upper panel) and anti-FLAG (lower panel). Left lanes, unprocessed extracts (input). (B) Human 293T cells were transfected as in panel A. Proteins immunoprecipitated with anti-HA antibody and immunoblotted with anti-FLAG (upper panel), and anti-HA (lower panel). Left lanes, unprocessed extracts (input). (C) Immunoprecipitation of SIRT1 from LN-CAP cell extracts using anti-SIRT1 antibody or normal rabbit IgG as a control (IgG). 10% of the immunoprecipitated protein was then blotted with anti-SIRT1 (upper panel) while the remaining 90% was blotted with anti-β-catenin antibodies. (D) 293T cells were transfected as indicated and lysed 48 hr later. Comparable levels of β-catenin were immunoprecipitated and blotted for acetylated-lysine residues (IP: HA IB: Ac-K; upper panel). The blot was reprobed for HA to demonstrate approximately equal levels of the HA-β-catenin (IP: HA IB: HA; lower panel). (E–F) 293T cells were transfected as indicated together with the TOP-FLASH luciferase and PRL-TK Renilla luciferase construct. Nicotinamide (NAM) or retroviral SIRT1 shRNA (RNAi) was added as indicated. Data are normalized with respect to Renilla luciferase activity. The data are means±s.d. from samples performed in triplicate. (G) Indirect immunofluorescence staining of DLD-1 colon cancer cells infected with empty retrovirus or virus containing SIRT1 shRNA (RNAi) or SIRT1 cDNA (overexpression, O/E). Percent of cells with high, medium, or low levels of nuclear β-catenin staining for untreated: 6.5, 80.6, 12.9; SIRT1 O/E: 0, 29.4, 70.5; SIRT1 RNAi: 60.0, 32.0, 0.8. Images were taken at 100× magnification.
Figure 5. SIRT1 expression occurs in a subset of human colon cancers and inversely correlates with the nuclear localization of β-catenin.
(A) Representative images illustrating SIRT1 and β-catenin subcellular expression in human colon tumors. For each colon cancer case shown a text box insert indicates the detected protein (Image magnification 200×). (B) Correlation of SIRT1 and β-catenin expression in human colon tumors. The bar graph depicts cumulative immunostaining data from a tissue microarray of 81 colon cancer cases. Nuclear expression was scored as either no expression, weak expression, or moderate/strong expression. Positivity in nucleus was defined as moderate/strong expression. All slides were interpreted by two board certified pathologist blinded from any other clinical and laboratory data.
Similar articles
- SIRT1 inhibits proliferation of pancreatic cancer cells expressing pancreatic adenocarcinoma up-regulated factor (PAUF), a novel oncogene, by suppression of β-catenin.
Cho IR, Koh SS, Malilas W, Srisuttee R, Moon J, Choi YW, Horio Y, Oh S, Chung YH. Cho IR, et al. Biochem Biophys Res Commun. 2012 Jun 29;423(2):270-5. doi: 10.1016/j.bbrc.2012.05.107. Epub 2012 May 26. Biochem Biophys Res Commun. 2012. PMID: 22640743 - Frizzled 7 expression is positively regulated by SIRT1 and β-catenin in breast cancer cells.
Simmons GE Jr, Pandey S, Nedeljkovic-Kurepa A, Saxena M, Wang A, Pruitt K. Simmons GE Jr, et al. PLoS One. 2014 Jun 4;9(6):e98861. doi: 10.1371/journal.pone.0098861. eCollection 2014. PLoS One. 2014. PMID: 24897117 Free PMC article. - Transcriptional regulation of neuronal genes and its effect on neural functions: NAD-dependent histone deacetylase SIRT1 (Sir2alpha).
Hisahara S, Chiba S, Matsumoto H, Horio Y. Hisahara S, et al. J Pharmacol Sci. 2005 Jul;98(3):200-4. doi: 10.1254/jphs.fmj05001x2. Epub 2005 Jul 9. J Pharmacol Sci. 2005. PMID: 16006743 Review. - SIRT1: roles in aging and cancer.
Kim EJ, Um SJ. Kim EJ, et al. BMB Rep. 2008 Nov 30;41(11):751-6. doi: 10.5483/bmbrep.2008.41.11.751. BMB Rep. 2008. PMID: 19017485 Review.
Cited by
- Integration of β-catenin, sirtuin, and FOXO signaling protects from mutant huntingtin toxicity.
Parker JA, Vazquez-Manrique RP, Tourette C, Farina F, Offner N, Mukhopadhyay A, Orfila AM, Darbois A, Menet S, Tissenbaum HA, Neri C. Parker JA, et al. J Neurosci. 2012 Sep 5;32(36):12630-40. doi: 10.1523/JNEUROSCI.0277-12.2012. J Neurosci. 2012. PMID: 22956852 Free PMC article. - Expression of SIRT1 and DBC1 in Gastric Adenocarcinoma.
Kang Y, Jung WY, Lee H, Lee E, Kim A, Kim BH. Kang Y, et al. Korean J Pathol. 2012 Dec;46(6):523-31. doi: 10.4132/KoreanJPathol.2012.46.6.523. Epub 2012 Dec 26. Korean J Pathol. 2012. PMID: 23323102 Free PMC article. - The histone deacetylase SIRT6 is a tumor suppressor that controls cancer metabolism.
Sebastián C, Zwaans BM, Silberman DM, Gymrek M, Goren A, Zhong L, Ram O, Truelove J, Guimaraes AR, Toiber D, Cosentino C, Greenson JK, MacDonald AI, McGlynn L, Maxwell F, Edwards J, Giacosa S, Guccione E, Weissleder R, Bernstein BE, Regev A, Shiels PG, Lombard DB, Mostoslavsky R. Sebastián C, et al. Cell. 2012 Dec 7;151(6):1185-99. doi: 10.1016/j.cell.2012.10.047. Cell. 2012. PMID: 23217706 Free PMC article. - Inhibition of the NAD-dependent protein deacetylase SIRT2 induces granulocytic differentiation in human leukemia cells.
Sunami Y, Araki M, Hironaka Y, Morishita S, Kobayashi M, Liew EL, Edahiro Y, Tsutsui M, Ohsaka A, Komatsu N. Sunami Y, et al. PLoS One. 2013;8(2):e57633. doi: 10.1371/journal.pone.0057633. Epub 2013 Feb 27. PLoS One. 2013. PMID: 23460888 Free PMC article. - Rejuvenating sirtuins: the rise of a new family of cancer drug targets.
Bruzzone S, Parenti MD, Grozio A, Ballestrero A, Bauer I, Del Rio A, Nencioni A. Bruzzone S, et al. Curr Pharm Des. 2013;19(4):614-23. doi: 10.2174/138161213804581954. Curr Pharm Des. 2013. PMID: 23016857 Free PMC article. Review.
References
- Weindruch R, Walford RL. Dietary restriction in mice beginning at 1 year of age: effect on life-span and spontaneous cancer incidence. Science. 1982;215:1415–1418. - PubMed
- Sinclair DA. Toward a unified theory of caloric restriction and longevity regulation. Mech Ageing Dev. 2005;126:987–1002. - PubMed
- Guarente L, Picard F. Calorie restriction–the SIR2 connection. Cell. 2005;120:473–482. - PubMed
- Yamamoto H, Schoonjans K, Auwerx J. Sirtuin functions in health and disease. Mol Endocrinol. 2007;21:1745–1755. - PubMed
- Lim CS. SIRT1: Tumor promoter or tumor suppressor? Med Hypotheses 2006 - PubMed
Publication types
MeSH terms
Substances
Grants and funding
- R01 AG028730/AG/NIA NIH HHS/United States
- R01 AG019719-07/AG/NIA NIH HHS/United States
- R01 AG028730-02/AG/NIA NIH HHS/United States
- R01 AG019719/AG/NIA NIH HHS/United States
- R01 AG019719-06A1/AG/NIA NIH HHS/United States
- R01 AG028730-03/AG/NIA NIH HHS/United States
- R01 AG028730-01A1/AG/NIA NIH HHS/United States
- ImNIH/Intramural NIH HHS/United States
LinkOut - more resources
Full Text Sources
Other Literature Sources
Molecular Biology Databases
Research Materials


