Transcriptome architecture across tissues in the pig - PubMed (original) (raw)
Comparative Study
Transcriptome architecture across tissues in the pig
André L J Ferraz et al. BMC Genomics. 2008.
Abstract
Background: Artificial selection has resulted in animal breeds with extreme phenotypes. As an organism is made up of many different tissues and organs, each with its own genetic programme, it is pertinent to ask: How relevant is tissue in terms of total transcriptome variability? Which are the genes most distinctly expressed between tissues? Does breed or sex equally affect the transcriptome across tissues?
Results: In order to gain insight on these issues, we conducted microarray expression profiling of 16 different tissues from four animals of two extreme pig breeds, Large White and Iberian, two males and two females. Mixed model analysis and neighbor - joining trees showed that tissues with similar developmental origin clustered closer than those with different embryonic origins. Often a sound biological interpretation was possible for overrepresented gene ontology categories within differentially expressed genes between groups of tissues. For instance, an excess of nervous system or muscle development genes were found among tissues of ectoderm or mesoderm origins, respectively. Tissue accounted for ~11 times more variability than sex or breed. Nevertheless, we were able to confidently identify genes with differential expression across tissues between breeds (33 genes) and between sexes (19 genes). The genes primarily affected by sex were overall different than those affected by breed or tissue. Interaction with tissue can be important for differentially expressed genes between breeds but not so much for genes whose expression differ between sexes.
Conclusion: Embryonic development leaves an enduring footprint on the transcriptome. The interaction in gene x tissue for differentially expressed genes between breeds suggests that animal breeding has targeted differentially each tissue's transcriptome.
Figures
Figure 1
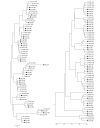
NJ (left) and UPGMA trees (right) using the 1 - _r_2 distance. Each sample is named using the tissue acronym (four letters, Table 1), breed (LW or IB) and sex (M, male or F, female); LW males are indicated by open squares; LW females, by open circles; IB males, by black squares and IB females, by black circles.
Figure 2
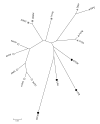
NJ tree of tissues using the 1-rT2 Distance. The four groups in Table 1 are indicated by symbols: brain (open squares), endocrine (grey squares), structural (grey triangles) and metabolic (black circles).
Figure 3
Differential GO categories across embryo layers. Percentage of the most frequent GO categories within extreme genes for each embryonic layer (A, ectoderm; B, mesoderm; C, endoderm; D, all genes in A, B and C). The number in each category is the false discovery rate (FDR) that the category is over represented with respect to the GO frequency across all genes in the microarray. The FDR is shown only if < 0.20.
Figure 4
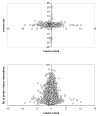
Relation between _z_-scores. Plot of _z_-scores of breeds and sexes (top), and between the breed _z_-scores and the standard deviation within probes of Probe × Tissue solutions (bottom).
Figure 5
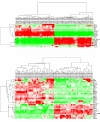
Sample clustering using differentially expressed genes. Genes differentially expressed between sexes (top) and breeds (bottom).
Figure 6
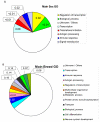
Proportion of functional annotation categories. Percentage of the most frequent GO categories within the most significant differentially expressed genes between sexes (Table 3) and between breeds (Table 4). The number in each category is the false discovery rate (FDR) that the category is over represented with respect to the GO frequency across all genes in the microarray. The FDR is shown only if < 0.20.
Similar articles
- Impact of breed and sex on porcine endocrine transcriptome: a bayesian biometrical analysis.
Pérez-Enciso M, Ferraz AL, Ojeda A, López-Béjar M. Pérez-Enciso M, et al. BMC Genomics. 2009 Feb 24;10:89. doi: 10.1186/1471-2164-10-89. BMC Genomics. 2009. PMID: 19239697 Free PMC article. - Identification of genes differentially expressed during prenatal development of skeletal muscle in two pig breeds differing in muscularity.
Muráni E, Murániová M, Ponsuksili S, Schellander K, Wimmers K. Muráni E, et al. BMC Dev Biol. 2007 Oct 1;7:109. doi: 10.1186/1471-213X-7-109. BMC Dev Biol. 2007. PMID: 17908293 Free PMC article. - Differentially expressed transcripts in adipose tissue between Korean native pig and Yorkshire breeds.
Moon JK, Kim KS, Kim JJ, Choi BH, Cho BW, Kim TH, Lee CK. Moon JK, et al. Anim Genet. 2009 Feb;40(1):115-8. doi: 10.1111/j.1365-2052.2008.01798.x. Epub 2008 Oct 17. Anim Genet. 2009. PMID: 18945290 - Transcript profiling of expressed sequence tags from semimembranosus muscle of commercial and naturalized pig breeds.
Nascimento CS, Peixoto JO, Verardo LL, Campos CF, Weller MM, Faria VR, Botelho ME, Martins MF, Machado MA, Silva FF, Lopes PS, Guimarães SE. Nascimento CS, et al. Genet Mol Res. 2012 Sep 17;11(3):3315-28. doi: 10.4238/2012.June.15.1. Genet Mol Res. 2012. PMID: 22782623 - Genetic dissection of gene regulation in multiple mouse tissues.
Cotsapas CJ, Williams RB, Pulvers JN, Nott DJ, Chan EK, Cowley MJ, Little PF. Cotsapas CJ, et al. Mamm Genome. 2006 Jun;17(6):490-5. doi: 10.1007/s00335-005-0186-9. Epub 2006 Jun 12. Mamm Genome. 2006. PMID: 16783630 Review.
Cited by
- Molecular adaptations in response to exercise training are associated with tissue-specific transcriptomic and epigenomic signatures.
Nair VD, Pincas H, Smith GR, Zaslavsky E, Ge Y, Amper MAS, Vasoya M, Chikina M, Sun Y, Raja AN, Mao W, Gay NR, Esser KA, Smith KS, Zhao B, Wiel L, Singh A, Lindholm ME, Amar D, Montgomery S, Snyder MP, Walsh MJ, Sealfon SC; MoTrPAC Study Group. Nair VD, et al. Cell Genom. 2024 Jun 12;4(6):100421. doi: 10.1016/j.xgen.2023.100421. Epub 2024 May 1. Cell Genom. 2024. PMID: 38697122 Free PMC article. - A protein-coding gene expression atlas from the brain of pregnant and non-pregnant goats.
Luigi-Sierra MG, Guan D, López-Béjar M, Casas E, Olvera-Maneu S, Gardela J, Palomo MJ, Osuagwuh UI, Ohaneje UL, Mármol-Sánchez E, Amills M. Luigi-Sierra MG, et al. Front Genet. 2023 Jul 14;14:1114749. doi: 10.3389/fgene.2023.1114749. eCollection 2023. Front Genet. 2023. PMID: 37519888 Free PMC article. - Changes in Biceps femoris Transcriptome along Growth in Iberian Pigs Fed Different Energy Sources and Comparative Analysis with Duroc Breed.
Benítez R, Núñez Y, Ayuso M, Isabel B, Fernández-Barroso MA, De Mercado E, Gómez-Izquierdo E, García-Casco JM, López-Bote C, Óvilo C. Benítez R, et al. Animals (Basel). 2021 Dec 8;11(12):3505. doi: 10.3390/ani11123505. Animals (Basel). 2021. PMID: 34944282 Free PMC article. - Comprehensive Characterization of Multitissue Expression Landscape, Co-Expression Networks and Positive Selection in Pikeperch.
Nguinkal JA, Verleih M, de Los Ríos-Pérez L, Brunner RM, Sahm A, Bej S, Rebl A, Goldammer T. Nguinkal JA, et al. Cells. 2021 Sep 2;10(9):2289. doi: 10.3390/cells10092289. Cells. 2021. PMID: 34571938 Free PMC article. - Transcriptome Profiling across Five Tissues of Giant Panda.
Li F, Wang C, Xu Z, Li M, Deng L, Wei M, Zhang H, Wu K, Ning R, Li D, Yang M, Zhang M, Ni Q, Zeng B, Li D, Li Y. Li F, et al. Biomed Res Int. 2020 Aug 10;2020:3852586. doi: 10.1155/2020/3852586. eCollection 2020. Biomed Res Int. 2020. PMID: 32851066 Free PMC article.
References
Publication types
MeSH terms
LinkOut - more resources
Full Text Sources
Research Materials
