Dynamics of the microglial/amyloid interaction indicate a role in plaque maintenance - PubMed (original) (raw)
Comparative Study
Dynamics of the microglial/amyloid interaction indicate a role in plaque maintenance
Tristan Bolmont et al. J Neurosci. 2008.
Abstract
Microglial cells aggregate around amyloid plaques in Alzheimer's disease, but, despite their therapeutic potential, various aspects of their reactive kinetics and role in plaque pathogenesis remain hypothetical. Through use of in vivo imaging and quantitative morphological measures in transgenic mice, we demonstrate that local resident microglia rapidly react to plaque formation by extending processes and subsequently migrating toward plaques, in which individual transformed microglia somata remain spatially stable for weeks. The number of plaque-associated microglia increased at a rate of almost three per plaque per month, independent of plaque volume. Larger plaques were surrounded by larger microglia, and a subset of plaques changed in size over time, with an increase or decrease related to the volume of associated microglia. Far from adopting a more static role, plaque-associated microglia retained rapid process and membrane movement at the plaque/glia interface. Microglia internalized systemically injected amyloid-binding dye at a much higher rate in the vicinity of plaques. These results indicate a role for microglia in plaque maintenance and provide a model with multiple targets for therapeutic intervention.
Figures
Figure 1.
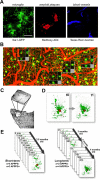
In vivo imaging methods and time course for quantification. A, Simultaneous imaging of three fluorescent signals was performed: green, microglia (through Iba-1-driven GFP expression); red, amyloid deposits [after systemic injection of methoxy-X04 (Klunk et al., 2002)]; and blue, blood vessel labeling as a spatial reference (through systemic injection of Texas Red-coupled dextran). B, An overview image before channel separation of blood vessels (red), microglia (green), and amyloid (yellow) spanning 1.8 mm, which allowed for matching individual plaques and microglia with subsequent histological sections. The location of Z projections from 4 of the 10 high-magnification image stacks from this mouse are shown as insets. The rightmost location is shown with histological analysis in Figure 6 (flipped vertically). C, A coordinate system was devised for consistent imaging of the same volumes using ambient illumination of blood vessels on the brain surface. D, Volume rendering of microglia/plaque interaction over time, in this case illustrating microglial migration. E, Image stacks were taken in multiple locations over time in each mouse (mean, 5 volumes per mouse for both APPPS1+ and APPPS1−), using two different protocols: “short term” for study of the dynamics of individual microglia and “long term” for study of plaque development and microglia migration/volume changes. Scale bar (in A), 50 μm. Images are from a maximum Z projection with a depth of 50 μm.
Figure 2.
Existing amyloid deposits are stable over time despite the microglial response. A, Long-term imaging of the same volume is shown with microglia in green, amyloid in yellow, and blood vessels in red (non-channel separated). Individual microglia surrounding amyloid remain stable over periods of 1 month (arrowheads), but new microglia are also evident (arrows). Microglial processes in each 12 h time interval have new spatial locations, with the exception of some of the largest processes, often also tied to amyloid. An example is also apparent of a resting microglia (open arrowhead) that first sends processes and subsequently migrates to contact a plaque. All images represent Z projections of 30 μm. Scale bar, 50 μm for all images. B, Quantification of mean plaque volume and microglia number and volume over time. Overall plaque volume remained stable over 1 month but differed between size categories. The number of microglia in each volume increased significantly over 1 month, independent of plaque volume. Although larger plaques were surrounded by larger microglia, the average microglia size did not increase over time. C, Size and volume of microglia are inter-related, and the upper limit of the microglial number increase around plaques is compensated by an increase in individual microglial volume. In APPPS1− mice (red diamonds), the number of microglia and the volume of individual microglia in any volume showed an inverse relationship (R 2 = 0.35; p < 0.001). The number of microglia surrounding plaques increased in relation to plaque volume, reaching an apparent ceiling at a plaque size of ∼15,000 μm3 (logarithmic regression, R 2 = 0.51; p < 0.0001). Values for each mouse represent the average of the long-term imaging sessions of the second month (similar results were obtained regardless of which month's values were used for this analysis).
Figure 3.
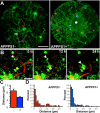
Microglia migrate in control mice and also in plaque-bearing mice, unless indefinitely attached to amyloid. A, Z projections (100 μm thick) of microglia in APPPS1− or APPPS1+ mice with the movement history of individual microglia superimposed in colored “tracks” (actual distance moved was calculated via manual identification of the soma location in three dimensions at various time points). The displayed session is the fifth (first session from the second month; yellow marker). The center of the amyloid deposit in the APPPS1+ mouse is indicated by an asterisk. Scale bar, 20 μm. B, A plaque-associated microglia (arrow) first sends processes toward the plaque (12 h), and subsequently migrates until the soma is in contact with the amyloid (24 h). Scale bar is 50 μm and images represent Z projections of 25 μm. C, The average movement of microglial soma over 1 month is significantly decreased in the plaque mice (APPPS1+, n = 248; APPPS1−, n = 106). D, Shown is a histogram of migration for individual microglia in APPPS1− mice (red) and APPPS1+ mice (blue). In both groups, the majority of microglia soma remained spatially stable over 1 month, but a subpopulation exhibits significant migration, up to 40 μm.
Figure 4.
Microglia process dynamics and length are altered in relation to amyloid. A, Two time points, separated by 9 min, are superimposed with voxels that were present in the first but not the second (retraction) indicated in purple, and in the second but not the first (extension) indicated in yellow, with all unchanged voxels in white. Process retractions and extensions in microglia from APPPS1− mice typically occur isotropically distributed throughout their ramified tree structure. In APPPS1+ mice, polarized microglia (arrow) and macrophagic microglia (arrowhead) “near” or “on” amyloid plaques no longer survey their environment in a distributed, isotropic manner. Inset, Right panel, Process movement (in this case, extension) was measured with lines drawn in three dimensions between the start and end of new processes. Scale bar, 50 μm. B, Significant differences in the total process length per cell were seen for the different categories, with microglia near plaques exhibiting increased process length, and those immediately “on” plaques with substantially reduced length (main group effect, F (1,22) = 22.2; p < 0.01 for all comparisons). Both types of plaque-associated microglia also showed significant polarity (indicated for the “near” microglia by diagonal shading for processes oriented toward plaques and solid for processes oriented in the opposite direction), with microglia “on” plaques only having processes oriented away from the plaque surface. C, Although morphology between the microglia types was substantially altered, the overall extent of process movement was similar (analyzed microglia: APPPS1−, n = 10; APPPS1+“near”, n = 10; APPPS1+“on”, n = 6), with only the microglia “on” amyloid exhibiting a slight but significant change in speed of process extension/retraction (μm/time point − 9 min).
Figure 5.
Amyloid plaque volume changes over time. A–D, Although the majority of plaques did not change in size over 1 month, examples of a reduction in plaque volume (A, B) and increase in plaque volume (C, D) were evident. Insets illustrate the contrasting microglia coverage from the shrinking plaque (A) versus a growing plaque (B). E, The individual volume measurements for the 13 of 39 plaques that had consistent volume change over multiple imaging sessions. Measurements from the four independent imaging sessions at 3 months of age are shown as blue circles, and data from the following month are shown as red diamonds. Only plaques with a significant difference between months are shown, and the plaques from A–D are indicated. F, The change in plaque volume over 1 month is related to microglia volume (total volume of all microglia/imaged volume, first month). Plaques that increased in volume over 1 month tended to have less microglia coverage, whereas those that decreased in volume had the most microglia. Scale bar: (in A) A–D, 25 μm. Figures are maximum Z projections of 25 μm.
Figure 6.
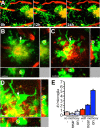
Uptake of Aβ by plaque-associated microglia. A, A macrophagic plaque-associated cell exhibits many internalized fluorescent particles that move within the cell soma over time (maximum Z projection, 35 μm). B–D, In vivo (B) and histological (C, D) analyses of the same plaque, microglia, and internalized puncta (B; red, blood vessels; green, microglia; yellow, methoxy X-04) confirm the localization and, via immunostaining, reveals colocalization with Aβ (C, D; red, Aβ via NT-12/Alexa 568, green, GFP+ microglia). The same punctum is indicated by an arrow and can be visualized as within the microglia in the orthogonal x and y projections (indicated by a circle). E, Quantification of puncta colocalized with microglia in vivo in uninjected mice versus those injected with methoxy-X-04 indicates a dramatic increase in the transgenic mice, particularly in the vicinity of amyloid plaques [number of microglia analyzed: no methoxy, 59/49/26; with methoxy, 62/57/71 (APPPS1−/near/on)]. Scale bars: A–C, 10 μm; D, 5 μm.
Figure 7.
Aβ is localized specifically within microglial lysosomes. A–D, lamp-1-positive lysosomes (A) colocalize with Aβ immunostaining (C) within GFP+ microglia (B), in the vicinity of amyloid plaques (C). Arrows indicate the most prominent example of a large Aβ-positive microglial lysosome, also apparent in the three-channel overlay (D). E–H, No internalization of Aβ or plaque-associated increase in lysosome labeling is observed for astrocytes. Arrow again indicates larger lysosomes found within a plaque-associated microglia. Although lysosomes can be found within astrocytes, no specific association with plaques is observed. Colocalization is observed however in the immunostaining of blood vessels (arrowhead), surrounded by labeling of astrocytic end feet. Images in both A–D and E–H represent maximum Z projections of 8 μm. Scale bar: (in A) A–D, 20 μm; E–H, 40 μm.
Similar articles
- Microglia contributes to plaque growth by cell death due to uptake of amyloid β in the brain of Alzheimer's disease mouse model.
Baik SH, Kang S, Son SM, Mook-Jung I. Baik SH, et al. Glia. 2016 Dec;64(12):2274-2290. doi: 10.1002/glia.23074. Epub 2016 Sep 23. Glia. 2016. PMID: 27658617 - Microglia depletion rapidly and reversibly alters amyloid pathology by modification of plaque compaction and morphologies.
Casali BT, MacPherson KP, Reed-Geaghan EG, Landreth GE. Casali BT, et al. Neurobiol Dis. 2020 Aug;142:104956. doi: 10.1016/j.nbd.2020.104956. Epub 2020 May 30. Neurobiol Dis. 2020. PMID: 32479996 Free PMC article. - IL-1β-driven amyloid plaque clearance is associated with an expansion of transcriptionally reprogrammed microglia.
Rivera-Escalera F, Pinney JJ, Owlett L, Ahmed H, Thakar J, Olschowka JA, Elliott MR, O'Banion MK. Rivera-Escalera F, et al. J Neuroinflammation. 2019 Dec 10;16(1):261. doi: 10.1186/s12974-019-1645-7. J Neuroinflammation. 2019. PMID: 31822279 Free PMC article. - Association of microglia with amyloid plaques in brains of APP23 transgenic mice.
Stalder M, Phinney A, Probst A, Sommer B, Staufenbiel M, Jucker M. Stalder M, et al. Am J Pathol. 1999 Jun;154(6):1673-84. doi: 10.1016/S0002-9440(10)65423-5. Am J Pathol. 1999. PMID: 10362792 Free PMC article. - Microglia in Alzheimer's Disease.
Süß P, Schlachetzki JCM. Süß P, et al. Curr Alzheimer Res. 2020;17(1):29-43. doi: 10.2174/1567205017666200212155234. Curr Alzheimer Res. 2020. PMID: 32048973 Review.
Cited by
- Roles of microglia in brain development, tissue maintenance and repair.
Michell-Robinson MA, Touil H, Healy LM, Owen DR, Durafourt BA, Bar-Or A, Antel JP, Moore CS. Michell-Robinson MA, et al. Brain. 2015 May;138(Pt 5):1138-59. doi: 10.1093/brain/awv066. Epub 2015 Mar 29. Brain. 2015. PMID: 25823474 Free PMC article. Review. - The role of ABCB1 and ABCA1 in beta-amyloid clearance at the neurovascular unit in Alzheimer's disease.
Elali A, Rivest S. Elali A, et al. Front Physiol. 2013 Mar 13;4:45. doi: 10.3389/fphys.2013.00045. eCollection 2013. Front Physiol. 2013. PMID: 23494712 Free PMC article. - Microglia and inflammation in Alzheimer's disease.
Mandrekar-Colucci S, Landreth GE. Mandrekar-Colucci S, et al. CNS Neurol Disord Drug Targets. 2010 Apr;9(2):156-67. doi: 10.2174/187152710791012071. CNS Neurol Disord Drug Targets. 2010. PMID: 20205644 Free PMC article. Review. - Microvessel occlusions alter amyloid-beta plaque morphology in a mouse model of Alzheimer's disease.
Zhang Y, Bander ED, Lee Y, Muoser C, Schaffer CB, Nishimura N. Zhang Y, et al. J Cereb Blood Flow Metab. 2020 Oct;40(10):2115-2131. doi: 10.1177/0271678X19889092. Epub 2019 Nov 19. J Cereb Blood Flow Metab. 2020. PMID: 31744388 Free PMC article. - APOE genotype and sex affect microglial interactions with plaques in Alzheimer's disease mice.
Stephen TL, Cacciottolo M, Balu D, Morgan TE, LaDu MJ, Finch CE, Pike CJ. Stephen TL, et al. Acta Neuropathol Commun. 2019 May 21;7(1):82. doi: 10.1186/s40478-019-0729-z. Acta Neuropathol Commun. 2019. PMID: 31113487 Free PMC article.
References
- Andra K, Abramowski D, Duke M, Probst A, Wiederhold KH, Burki K, Goedert M, Sommer B, Staufenbiel M. Expression of APP in transgenic mice: a comparison of neuron-specific promoters. Neurobiol Aging. 1996;17:183–190. - PubMed
- Bacskai BJ, Hyman BT. Alzheimer's disease: what multiphoton microscopy teaches us. The Neuroscientist. 2002;8:386–390. - PubMed
- Bard F, Cannon C, Barbour R, Burke RL, Games D, Grajeda H, Guido T, Hu K, Huang J, Johnson-Wood K, Khan K, Kholodenko D, Lee M, Lieberburg I, Motter R, Nguyen M, Soriano F, Vasquez N, Weiss K, Welch B, Seubert P, Schenk D, Yednock T. Peripherally administered antibodies against amyloid beta-peptide enter the central nervous system and reduce pathology in a mouse model of Alzheimer disease. Nat Med. 2000;6:916–919. - PubMed
Publication types
MeSH terms
Substances
LinkOut - more resources
Full Text Sources
Other Literature Sources


