Ethanol enhances GABAergic transmission onto dopamine neurons in the ventral tegmental area of the rat - PubMed (original) (raw)
Ethanol enhances GABAergic transmission onto dopamine neurons in the ventral tegmental area of the rat
Jonathan W Theile et al. Alcohol Clin Exp Res. 2008 Jun.
Abstract
Background: Activation of the dopaminergic (DA) neurons of the ventral tegmental area (VTA) by ethanol has been implicated in its rewarding and reinforcing effects. At most central synapses, ethanol generally increases inhibitory synaptic transmission; however, no studies have explored the effect of acute ethanol on GABAergic transmission in the VTA.
Methods: Whole-cell patch clamp recordings of inhibitory postsynaptic currents (IPSCs) from VTA-DA neurons in midbrain slices from young rats.
Results: Acute exposure of VTA-DA neurons to ethanol (25 to 50 mM) robustly enhanced GABAergic spontaneous and miniature IPSC frequency while inducing a slight enhancement of spontaneous IPSC (sIPSC) amplitude. Ethanol (50 mM) enhanced paired-pulse depression of evoked IPSCs, further suggesting enhanced GABA release onto VTA-DA neurons. The frequency of sIPSCs was suppressed by the GABA(B) agonist, baclofen (1.25 microM) and enhanced by the antagonist, SCH50911 (20 microM); however, neither appeared to modulate or occlude the effects of ethanol on sIPSC frequency.
Conclusions: The present results indicate that ethanol increases postsynaptic GABA(A) receptor sensitivity, enhances action potential-independent GABA release onto VTA-DA neurons, and that this latter effect is independent of GABA(B) auto-receptor inhibition of GABA release.
Figures
Fig. 1
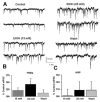
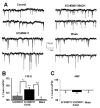
Ethanol (25 mM) potentiates sIPSC frequency. (A) sIPSCs recorded from a VTA-DA neuron under control conditions, in the presence of 15 and 25 mM ethanol, and after a washout. (B) A bar graph representing the percent change ± SEM above control sIPSC frequency for the conditions shown in (A). Event frequency under control conditions was 4.62 ± 0.75 Hz. (C) A bar graph representing the percent change ± SEM above control sIPSC amplitude for the conditions shown in (A). Event amplitude under control conditions was 52.82 ± 2.28 pA. (n = 7, *p < 0.05 by ANOVA/Dunnett C posthoc different from control).
Fig. 2
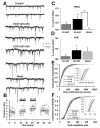
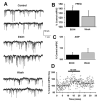
Ethanol (50 mM) potentiates sIPSC frequency and amplitude. (A) sIPSCs recorded from a VTA-DA neuron under control conditions, in the presence of 25 and 50 mM ethanol, and after a washout. (B) Time course for a sample representative neuron under conditions shown in (A). The dotted lines represent the average frequency under each condition for that neuron. (C) A bar graph representing the percent change ± SEM above control sIPSC frequency for the conditions shown in (A). Event frequency under control conditions was 5.48 ± 0.93 Hz. (D) A bar graph representing the percent change ± SEM above control sIPSC amplitude for the conditions shown in (A). Event amplitude under control conditions was 54.49 ± 5.56 pA. (E) Cumulative probability histogram of sIPSC inter-event intervals for epochs from same neuron shown in (B). (F) Cumulative probability histogram of sIPSC event amplitudes from the same neuron shown in (B), (E). (n = 8, *p < 0.05 by ANOVA/Dunnett C posthoc different from control, *†p < 0.05 by ANOVA/Dunnett C posthoc different from wash).
Fig. 3
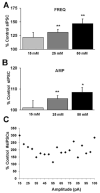
Cumulative results show ethanol-induced potentiation of sIPSC frequency and amplitude at varying concentrations. (A) A bar graph representing the percent change ± SEM above control sIPSC frequency in the presence of 15, 25, and 50 mM ethanol. Event frequency under control conditions was 4.92 ± 0.44 Hz. (B) A bar graph representing the percent change ± SEM above control sIPSC amplitude for the conditions shown in (A). Event amplitude under control conditions was 52.92 ± 2.06 pA. (n = 7 for 15 mM, n = 22 for 25 mM, n = 11 for 50 mM; *p < 0.05, **_p_ < 0.01 by ANOVA/Dunnett C posthoc different from control) (**C**) A sample cell was analyzed that showed a maximal ethanol-induced (50 mM) enhancement in sIPSC frequency (∼86% above control) to determine the percent change in the number of events at their respective amplitude distribution. The events were binned into 5 pA groups, for example, the point at 30 pA represents all events >25 and <30 pA. All events at 105 pA represent those events greater than 100 pA in size. The total number of events was 1,148 and 2,135 in control and ethanol conditions, respectively, taken from a time course of 5 minutes for each condition (note: the 300% change in events <15 pA represents an increase from only 4 to 12 events).
Fig. 4
Ethanol enhances paired-pulse depression. (A), (B) Sample evoked IPSC recordings from a VTA-DA neuron prior to (A), and after exposure to ethanol (50 mM) (B). Each trace represents an averaged trace from 8 individual traces over a continuous 3.5-minute time period for each condition from a representative neuron. Both recordings exhibit paired-pulse depression (PPD); however after exposure to ethanol, the PPD is enhanced. (C) A bar graph representing the paired-pulse ratio (defined as IPS-C2/IPSC1) under control conditions and in the presence of ethanol (50 mM). (D) A bar graph representing the decay time as measured by the time constant, τ (milliseconds), under control conditions and in the presence of ethanol (50 mM). (n = 5 of 6, *p < 0.05 by a paired student's _t_-test different from control).
Fig. 5
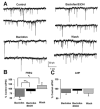
Baclofen does not inhibit ethanol-induced potentiation of sIPSC frequency. (A) sIPSCs recorded from a VTA-DA neuron under control conditions, in the presence of 1.25 μ_M baclofen, 50 mM ethanol with 1.25 μ_M baclofen, and after a washout. (B) A bar graph representing the percent change ± SEM above control sIPSC frequency for the conditions shown in (A). Event frequency under control conditions was 2.36 ± 0.23 Hz. (C) A bar graph representing the percent change ± SEM above control sIPSC amplitude for the conditions shown in (A). Event amplitude under control conditions was 49.48 ± 3.41 pA. (n = 6, **p < 0.01 by ANOVA/Dunnett C posthoc different from control, *†_p < 0.05 by ANOVA/Dunnett C posthoc different from baclofen alone, **††_p < 0.01 by a paired student's _t_-test different from baclofen alone).
Fig. 6
SCH50911 does not occlude ethanol-induced potentiation of sIPSC frequency. (A) sIPSCs recorded from a VTA-DA neuron under control conditions, in the presence of 20 _μ_M SCH50911, 50 mM ethanol with 20 μ_M SCH50911, and after a washout. (B) A bar graph representing the percent change ± SEM above control sIPSC frequency for the conditions shown in (A). Event frequency under control conditions was 1.89 ± 0.40 Hz. (C) A bar graph representing the percent change ± SEM above control sIPSC amplitude for the conditions shown in (A). Event amplitude under control conditions was 51.58 ± 2.24 pA. (n = 6, *p < 0.05 by ANOVA/Tukey HSD posthoc different from control, **p < 0.01 by ANOVA/Tukey HSD posthoc different from control, *†_p < 0.05 by ANOVA/Tukey HSD posthoc and by paired student's t_-test different from SCH50911 alone, *††_p < 0.05 by ANOVA/Tukey HSD posthoc different from wash).
Fig. 7
Ethanol (50 mM) potentiates mIPSC frequency. (A) mIPSCs recorded from a VTA-DA neuron under control conditions, in the presence of 50 mM ethanol, and after a washout. (B) A bar graph representing the percent change ± SEM above control mIPSC frequency for the conditions shown in (A). Event frequency under control conditions was 2.57 ± 0.45 Hz. (C) A bar graph representing the percent change ± SEM above control mIPSC amplitude for the conditions shown in (A). Event amplitude under control conditions was 43.13 ± 3.88 pA. (D) Cumulative time course for averaged cells. The dotted lines indicate the averaged value displayed in (B). (n = 11, *p < 0.05 by student's _t_-test different from control).
Similar articles
- Ethanol dually modulates GABAergic synaptic transmission onto dopaminergic neurons in ventral tegmental area: role of mu-opioid receptors.
Xiao C, Ye JH. Xiao C, et al. Neuroscience. 2008 Apr 22;153(1):240-8. doi: 10.1016/j.neuroscience.2008.01.040. Epub 2008 Feb 6. Neuroscience. 2008. PMID: 18343590 Free PMC article. - GABAergic transmission modulates ethanol excitation of ventral tegmental area dopamine neurons.
Theile JW, Morikawa H, Gonzales RA, Morrisett RA. Theile JW, et al. Neuroscience. 2011 Jan 13;172:94-103. doi: 10.1016/j.neuroscience.2010.10.046. Epub 2010 Oct 23. Neuroscience. 2011. PMID: 20974231 Free PMC article. - Role of 5-hydroxytryptamine2C receptors in Ca2+-dependent ethanol potentiation of GABA release onto ventral tegmental area dopamine neurons.
Theile JW, Morikawa H, Gonzales RA, Morrisett RA. Theile JW, et al. J Pharmacol Exp Ther. 2009 May;329(2):625-33. doi: 10.1124/jpet.108.147793. Epub 2009 Feb 18. J Pharmacol Exp Ther. 2009. PMID: 19225162 Free PMC article. - VTA dopamine neuron plasticity - the unusual suspects.
Xin W, Edwards N, Bonci A. Xin W, et al. Eur J Neurosci. 2016 Dec;44(12):2975-2983. doi: 10.1111/ejn.13425. Epub 2016 Nov 1. Eur J Neurosci. 2016. PMID: 27711998 Free PMC article. Review. - Modulation of GABAA receptors in cerebellar granule neurons by ethanol: a review of genetic and electrophysiological studies.
Botta P, Radcliffe RA, Carta M, Mameli M, Daly E, Floyd KL, Deitrich RA, Valenzuela CF. Botta P, et al. Alcohol. 2007 May;41(3):187-99. doi: 10.1016/j.alcohol.2007.04.004. Epub 2007 May 23. Alcohol. 2007. PMID: 17521847 Free PMC article. Review.
Cited by
- Alcohol effects on synaptic transmission in periaqueductal gray dopamine neurons.
Li C, McCall NM, Lopez AJ, Kash TL. Li C, et al. Alcohol. 2013 Jun;47(4):279-87. doi: 10.1016/j.alcohol.2013.02.002. Epub 2013 Apr 15. Alcohol. 2013. PMID: 23597415 Free PMC article. - Primate cerebellar granule cells exhibit a tonic GABAAR conductance that is not affected by alcohol: a possible cellular substrate of the low level of response phenotype.
Mohr C, Kolotushkina O, Kaplan JS, Welsh J, Daunais JB, Grant KA, Rossi DJ. Mohr C, et al. Front Neural Circuits. 2013 Nov 26;7:189. doi: 10.3389/fncir.2013.00189. eCollection 2013. Front Neural Circuits. 2013. PMID: 24324408 Free PMC article. - Opposing actions of CRF-R1 and CB1 receptors on VTA-GABAergic plasticity following chronic exposure to ethanol.
Harlan BA, Becker HC, Woodward JJ, Riegel AC. Harlan BA, et al. Neuropsychopharmacology. 2018 Sep;43(10):2064-2074. doi: 10.1038/s41386-018-0106-9. Epub 2018 Jun 9. Neuropsychopharmacology. 2018. PMID: 29946104 Free PMC article. - Ethanol action on dopaminergic neurons in the ventral tegmental area: interaction with intrinsic ion channels and neurotransmitter inputs.
Morikawa H, Morrisett RA. Morikawa H, et al. Int Rev Neurobiol. 2010;91:235-88. doi: 10.1016/S0074-7742(10)91008-8. Int Rev Neurobiol. 2010. PMID: 20813245 Free PMC article. Review. - Synaptic targets: Chronic alcohol actions.
Roberto M, Varodayan FP. Roberto M, et al. Neuropharmacology. 2017 Aug 1;122:85-99. doi: 10.1016/j.neuropharm.2017.01.013. Epub 2017 Jan 17. Neuropharmacology. 2017. PMID: 28108359 Free PMC article. Review.
References
- Albanese A, Minciacchi D. Organization of the ascending projections from the ventral tegmental area: a multiple fluorescent retrograde tracer study in the rat. J Comp Neurol. 1983;216:406–420. - PubMed
- Appel SB, McBride WJ, Diana M, Diamond I, Bonci A, Brodie MS. Ethanol effects on dopaminergic “reward” neurons in the ventral tegmental area and the mesolimbic pathway. Alcohol Clin Exp Res. 2004;28:1768–1778.
- Brodie MS, Appel SB. The effects of ethanol on dopaminergic neurons of the ventral tegmental area studied with intracellular recording in brain slices. Alcohol Clin Exp Res. 1998;22:236–244. - PubMed
Publication types
MeSH terms
Substances
Grants and funding
- R01 AA 15167/AA/NIAAA NIH HHS/United States
- R01 AA014874/AA/NIAAA NIH HHS/United States
- R01 AA 14874/AA/NIAAA NIH HHS/United States
- R01 AA015521/AA/NIAAA NIH HHS/United States
- R01 AA015167/AA/NIAAA NIH HHS/United States
LinkOut - more resources
Full Text Sources
