Highly integrated single-base resolution maps of the epigenome in Arabidopsis - PubMed (original) (raw)
Highly integrated single-base resolution maps of the epigenome in Arabidopsis
Ryan Lister et al. Cell. 2008.
Abstract
Deciphering the multiple layers of epigenetic regulation that control transcription is critical to understanding how plants develop and respond to their environment. Using sequencing-by-synthesis technology we directly sequenced the cytosine methylome (methylC-seq), transcriptome (mRNA-seq), and small RNA transcriptome (smRNA-seq) to generate highly integrated epigenome maps for wild-type Arabidopsis thaliana and mutants defective in DNA methyltransferase or demethylase activity. At single-base resolution we discovered extensive, previously undetected DNA methylation, identified the context and level of methylation at each site, and observed local sequence effects upon methylation state. Deep sequencing of smRNAs revealed a direct relationship between the location of smRNAs and DNA methylation, perturbation of smRNA biogenesis upon loss of CpG DNA methylation, and a tendency for smRNAs to direct strand-specific DNA methylation in regions of RNA-DNA homology. Finally, strand-specific mRNA-seq revealed altered transcript abundance of hundreds of genes, transposons, and unannotated intergenic transcripts upon modification of the DNA methylation state.
Figures
Figure 1. DNA Methylation Context and Chromosomal Distribution in Wild-Type Col-0
(A) Methylcytosines identified (top panel) in Col-0 from bisulfite-converted sequencing reads (bottom panel) for a region of chromosome 1, as represented in the AnnoJ browser. (B) The fraction of methylcytosines identified in each sequence context for Col-0, where H = A, C, or T. (C) The density of methylcytosines identified in each context, on each strand throughout chromosome 1, counted in 50 kb bins. (D) Distribution of the percentage methylation at each sequence context. The y axis indicates the fraction of the total methylcytosines that display each percentage of methylation (x axis), where percentage methylation was determined as the fraction of reads at a reference cytosine containing cytosines following bisulfite conversion. Fractions were calculated within bins of 10%, as indicated on the x axis.
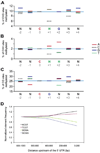
Figure 2. The Effect on Cytosine Methylation Frequency by Neighboring Bases
(A–C) The methylation frequency of cytosines in the (A) CHG, (B) CHH, and (C) CG contexts are shown as a function of proximal base composition. Base composition effects two positions upstream (−2) to four bases downstream (+4) of a particular cytosine are interrogated by dividing the number of methylcytosines to total cytosines of each base at each position. (D) The percent contribution of each CG tetramer (−1 to +2) was calculated in five 200 bp pair sections in the 1 kb region immediately upstream of all genes in the genome. For each tetramer, the percent contribution in the 800–1000 bp region was used to normalize all other regions.
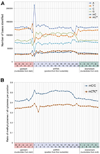
Figure 3. Methylation in DNA Methyltransferase and DNA Demethylase Mutant Plants
(A) The fraction of methylcytosines in each sequence context for each genotype. Positions were compared only where all genotypes had a sequence read depth between 6 and 10. (B) Ratio of the number of methylcytosines in each mutant versus Col-0 per 200 kb, where read depth was 6–10. The horizontal line represents Col-0, the plotted line represents percentage methylation in the mutant versus Col-0. (C) Average distribution of DNA methylation in each context throughout genes and 1 kb upstream and downstream in Col-0 and met1. Values are normalized to the highest point within each profile. (D) Density of sites of hypermethylation in rdd. The number of sites of DNA methylation present in rdd and absent in Col-0 was tabulated for promoters (1 kb upstream), 5′UTRs, gene bodies, and 3′UTRs, and the density of methylation in each normalized to the length of each feature. The number of features that contained hypermethylation above different lower thresholds of density was calculated, and the number of features of each type normalized relative to the feature with the most counts, for each lower threshold.
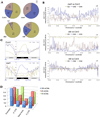
Figure 4. Distribution of smRNA Lenghts and Overlap between DNA Methylation and 24-mer smRNAs
(A) Nucleotide frequency and distribution flanking and within uniquely aligning 24-mer smRNAs. (B) Methylcytosine distribution presented as the ratio of methylcytosines to all cytosines located at each position flanking and within uniquely aligning 24-mer smRNAs. Abbreviations: mC, methylcytosine on the sense strand relative to the smRNA sequence; C, total cytosine on the sense strand; mC*, methylcytosine on the antisense strand; C*, total cytosine on the antisense strand.
Figure 5. Methylcytosine Density Correlates with smRNA Abundance
(A–C) Hierarchical clustering of all 1 kb regions of the nuclear genome that have significantly different methylcytosine and smRNA density between Col-0 and (A) met1, (B) ddc, and (C) rdd (see Experimental Procedures). Yellow indicates >3-fold change in methylcytosine density and >5-fold difference in number of sequenced bases of smRNA; black indicates no change above fold change thresholds. Minimum methylcytosines: 8 per kilo-base, minimum smRNA: 300 sequenced bases per kilo-base. (D) DNA methylation and smRNAs in Col-0 and met1. (E) DNA methylation and smRNAs in Col-0 and rdd. Tracks are shown for DNA methylation sites and smRNA. smRNAs are colored internally by their uniqueness (red: maps to a single location, greyscale: maps to multiple locations), and a surrounding box indicates the size class (orange:21-mer, black: 24-mer), and the shading represents the copy number (darker: more copies, lighter: fewer copies). Abbreviations: mC, methylcytosine.
Figure 6. Diverse Patterns of Interaction between DNA Methylation and smRNAs
(A) Hierarchical clustering of all 1 kb regions of the nuclear genome that have significantly different DNA methylation and/or smRNA density between Col-0 and met1 or ddc, and regions that show no difference (see Experimental Procedures). Yellow indicates >3-fold mC density and/or >5-fold smRNA difference;black indicates no difference above thresholds (<2-fold change in mC density or sequenced bases of smRNA). Minimum Col-0 mC: 8 per kilobase, minimum Col-0 smRNA: 300 sequenced bases per kilobase. (B–F) Typical examples from various clusters visualized in the AnnoJ browser. Tracks are shown for DNA methylation sites and smRNA. smRNAs are colored as in Figure 5. Abbreviations: mC, methylcytosine.
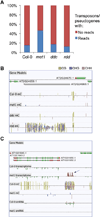
Figure 7. Identification of Upregulated Transposons and Intergenic Transcripts Regulated by DNA Methylation through mRNA-Seq
(A) The percentage of transposons/pseudogenes in the Arabidopsis genome for which mRNA-seq-based evidence of transcription was present or absent in each genotype. (B) Hypermethylation of transposons in rdd. Browser visualization of methylcytosines located within and proximal to the copia-like retrotransposon At2g24660. Dense methylation is present within the retrotransposon only in rdd. (C) An upregulated intergenic transcript identified in the DNA methyltransferase mutant met1 (indicated by arrow). Sites of DNA methylation are shown, and the color reflects the methylation context, as indicated.
Comment in
- Epigenome sequencing comes of age.
Zhu JK. Zhu JK. Cell. 2008 May 2;133(3):395-7. doi: 10.1016/j.cell.2008.04.016. Cell. 2008. PMID: 18455978 Free PMC article.
Similar articles
- Genome-wide high-resolution mapping and functional analysis of DNA methylation in arabidopsis.
Zhang X, Yazaki J, Sundaresan A, Cokus S, Chan SW, Chen H, Henderson IR, Shinn P, Pellegrini M, Jacobsen SE, Ecker JR. Zhang X, et al. Cell. 2006 Sep 22;126(6):1189-201. doi: 10.1016/j.cell.2006.08.003. Epub 2006 Aug 31. Cell. 2006. PMID: 16949657 - Extensive transcriptomic and epigenomic remodelling occurs during Arabidopsis thaliana germination.
Narsai R, Gouil Q, Secco D, Srivastava A, Karpievitch YV, Liew LC, Lister R, Lewsey MG, Whelan J. Narsai R, et al. Genome Biol. 2017 Sep 15;18(1):172. doi: 10.1186/s13059-017-1302-3. Genome Biol. 2017. PMID: 28911330 Free PMC article. - Genome-wide DNA methylome variation in two genetically distinct chicken lines using MethylC-seq.
Li J, Li R, Wang Y, Hu X, Zhao Y, Li L, Feng C, Gu X, Liang F, Lamont SJ, Hu S, Zhou H, Li N. Li J, et al. BMC Genomics. 2015 Oct 23;16:851. doi: 10.1186/s12864-015-2098-8. BMC Genomics. 2015. PMID: 26497311 Free PMC article. - Unlocking the Arabidopsis epigenome.
Reinders J, Paszkowski J. Reinders J, et al. Epigenetics. 2009 Nov 16;4(8):557-63. doi: 10.4161/epi.4.8.10347. Epub 2009 Nov 18. Epigenetics. 2009. PMID: 19934651 Review. - RNA-directed DNA methylation.
Zhang H, Zhu JK. Zhang H, et al. Curr Opin Plant Biol. 2011 Apr;14(2):142-7. doi: 10.1016/j.pbi.2011.02.003. Epub 2011 Mar 17. Curr Opin Plant Biol. 2011. PMID: 21420348 Free PMC article. Review.
Cited by
- Whole Genome Methylation Sequencing via Enzymatic Conversion (EM-seq): Protocol, Data Processing, and Analysis.
Olova NN, Andrews S. Olova NN, et al. Methods Mol Biol. 2025;2866:73-98. doi: 10.1007/978-1-0716-4192-7_5. Methods Mol Biol. 2025. PMID: 39546198 - Genome-wide DNA methylation and their transgenerational pattern differ in Arabidopsis thaliana populations originated along the elevation of West Himalaya.
Singh A, Verma AK, Kumar S, Bag SK, Roy S. Singh A, et al. BMC Plant Biol. 2024 Oct 9;24(1):936. doi: 10.1186/s12870-024-05641-0. BMC Plant Biol. 2024. PMID: 39385079 Free PMC article. - Molecular Mechanisms Underlying Freezing Tolerance in Plants: Implications for Cryopreservation.
Białoskórska M, Rucińska A, Boczkowska M. Białoskórska M, et al. Int J Mol Sci. 2024 Sep 20;25(18):10110. doi: 10.3390/ijms251810110. Int J Mol Sci. 2024. PMID: 39337593 Free PMC article. Review. - RNA-Seq analysis reveals the different mechanisms triggered by bovine and equine after infection with FMDV.
Wu Y, Li L, Bai W, Li T, Qian X, Liu Y, Wang S, Liu C, Wan F, Zhang D, Liu Y, Wu K, Ling Y, Zhou H, Meng F, Zhang Y, Cao J. Wu Y, et al. Vet Med Sci. 2024 Sep;10(5):e1569. doi: 10.1002/vms3.1569. Vet Med Sci. 2024. PMID: 39287214 Free PMC article. - Improved inference of population histories by integrating genomic and epigenomic data.
Sellinger T, Johannes F, Tellier A. Sellinger T, et al. Elife. 2024 Sep 12;12:RP89470. doi: 10.7554/eLife.89470. Elife. 2024. PMID: 39264367 Free PMC article.
References
- Aufsatz W, Mette MF, Matzke AJ, Matzke M. The role of MET1 in RNA-directed de novo and maintenance methylation of CG dinucleotides. Plant Mol. Biol. 2004;54:793–804. - PubMed
- Bernstein BE, Meissner A, Lander ES. The mammalian epigenome. Cell. 2007;128:669–681. - PubMed
- Bestor TH. The DNA methyltransferases of mammals. Hum. Mol. Genet. 2000;9:2395–2402. - PubMed
- Cao X, Aufsatz W, Zilberman D, Mette MF, Huang MS, Matzke M, Jacobsen SE. Role of the DRM and CMT3 methyltransferases in RNA-directed DNA methylation. Curr. Biol. 2003;13:2212–2217. - PubMed
- Cao X, Jacobsen SE. Role of the arabidops is DRM methyltransferases in de novo DNA methylation and gene silencing. Curr. Biol. 2002;12:1138–1144. - PubMed
Publication types
MeSH terms
Substances
Grants and funding
- R01 HG003523/HG/NHGRI NIH HHS/United States
- R01 HG003523-01/HG/NHGRI NIH HHS/United States
- R01 HG003523-02/HG/NHGRI NIH HHS/United States
- R01 HG003523-03/HG/NHGRI NIH HHS/United States
LinkOut - more resources
Full Text Sources
Other Literature Sources


