Response patterns to sound associated with labeled globular/bushy cells in cat - PubMed (original) (raw)
Response patterns to sound associated with labeled globular/bushy cells in cat
W S Rhode. Neuroscience. 2008.
Abstract
The mammalian cochlear nucleus (CN) consists of a diverse set of neurons both physiologically and morphologically that are involved in processing different aspects of the sound signal. One class of CN neurons that is located near the entrance of the auditory nerve (AN) to the CN has an oval soma with an eccentric nucleus and a short-bushy dendritic tree and is called a globular/bushy cell (GBC). They contact the principal cells of the medial nucleus of the trapezoid body (MNTB) with the very large calyx of Held that is one of the most secure synapses in the brain. Because MNTB cells provide an inhibitory input to the lateral superior olive (LSO), a structure purported to play a role in lateralizing high frequency sounds, GBC physiology is of great interest. Results were obtained with intracellular recording and subsequent labeling with neurobiotin of 32 GBCs along with a number of cells characterized extracellularly as likely GBCs in the cochlear nucleus (CN) of cat. Their poststimulus discharge response pattern to repeated tones varies from a primarylike pattern, i.e. similar to the AN, to a primarylike pattern with a 0.5-2 ms notch after the initial spike, to an onset pattern with a low-sustained rate. They can represent low frequency tones and amplitude modulated signals exceptionally well with a temporal code.
Figures
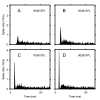
Figure 1
PSTHs for 9 GBCs with a range of CFs. A principal feature is a 0.5 -2 ms pause in activity after the initial spike that is likely the result of the neuron's refractory period. A pause only occurs when there is an onset spike for nearly 100% of the trials. Unit CF and spontaneous rate (SR in spikes/second) are indicated in each panel. Binwidth is 100 μs.
Figure 2
Responses of a PLn unit at four intensities, 30 to 90 dB SPL in 20 dB steps. Threshold = 18 dB SPL and CF = 10165 Hz. 50 ms tones of which only the initial 26 ms is shown. The firing rate remained constant beyond 20 ms at each intensity level.
Figure 3
Receptive field maps for six units that exhibited a PLn/OnL response pattern for a range of CFs, as indicated in each panel. All the data but that in panel D were obtained from labeled GBCs. The neuron from which panel D was obtained was not successfully labeled after recording intracellularly for an extended period. A higher discharge rate at low frequencies results from the tendency of GBCs to try to discharge on every stimulus cycle at a precise phase, to low frequency stimuli (E). Panels C and F illustrate inhibition of spontaneous activity in the frequency region above CF, where the curves fall below the baseline of the receptive field (indicated by the triangular symbols). In each panel, increasing line thickness indicates increasing intensity, which varies from 0 to 90 dB SPL in 10 dB increments. Solid and dashed lines are alternated for clarity. The 30 and 90 dB SPL curves are labeled in panel F.
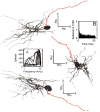
Figure 4
Three orthogonal views of a GBC with a single dendrite and the axon is shown in red. For the illustration at the top, the 3D morphology was obtained from tracings of coronal sections. The bottom two orthogonal views were computer generated using Neurolucida (MicroBrightField). Insets: A. receptive field for the cell where the linewidth increases with stimulus intensity that varies from 0 to 90 dB SPL in 10 dB steps. B. PSTH at CF = 9039 Hz and 60 dB SPL.
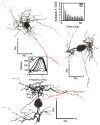
Figure 5
Three orthogonal views of a GBC with two primary dendrites. Axon is shown in red. The 3D morphology was obtained from tracings of coronal sections (top). The other orthogonal views were computer generated. Insets: A. receptive field where the linewidth increases with stimulus intensity that varies from 0 to 90 dB SPL in 10 dB steps. B. PSTH at CF = 875 Hz and 60 dB SPL.
Figure 6
A. Intracellular FM sweep recording from a GBC where the sinusoid was varied between 100 and 1000Hz. S indicates one of the axonal discharges propagated from the axonal initial segment to the soma. B. Expanded time scale for the first 75 ms of data in A emphasizes the large synchronous potentials at low frequencies. Note that at the lowest frequencies there can be two EPSPs per stimulus cycle where the second EPSP is narrower than the first (arrow1 and arrow2) and its amplitude decreases systematically with increasing frequency (arrow 3).
Figure 7
Intracellular records for a GBC with an OnL PSTH illustrating a stimulus synchronous membrane potential in response to five stimulus frequencies up to 2200 Hz (arrow in the bottom panel indicates the 2200 Hz intracellular potential). Note that the cell discharges on both the positive and negative phase of the 200 Hz stimulus (top panel): compare with the 400 Hz response in the second row. For this neuron, CF= 4300 Hz, Th = 10 dB SPL and SR = 16.5 spikes/s.
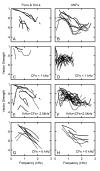
Figure 8
A. VS versus frequency at three intensities (70, 80 and 90 dB SPL) for two PLn neurons with CF = 2400 Hz (solid line) and CF = 1600 Hz (dashed line), respectively. Increasing line weight corresponds to increasing intensity in all panels. B. VS for three ANFs, each with a CF ∼1900Hz, illustrated by dashed (SR = 90 sp/s), dash-dot (SR =79 sp/s) and solid (SR = 1 sp/s) lines respectively, CFs = ∼ 1900 Hz. The VSs in all remaining panels were taken at 80 dB SPL. There was little variation in VS as a function of intensity for SPLs sufficiently above threshold. C. VS versus frequency for a 3 PLn/OnL units with CFs < 1 k Hz taken at 80 dB SPL. D. VS for 16 ANFs for the same level and frequency range as in C. E. VS for 7 PLn/OnL units with CFs between 1 and 2.5 kHz. F. VS for 21 ANFs for the same conditions as in E. G. VS for 6 PLn/OnL units with CFs > 6 kHz. H. VS for 6 ANFs for the same conditions as in G. In all panels: solid lines indicate SR (< 18 Spikes/s) and dashed lines indicate high-SR (> 18 spikes/s). Data from PL units judged to be from units in the NRA were not included here, though inclusion did not appear to significantly alter the results. ANF data are from Rhode and Smith's (1985) cat study.
Figure 9
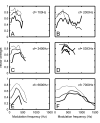
TMTFs shown at three different intensity levels for six PLn units with the CFs 700 to 7000 Hz. Modulation depth was 100%. AM intensity was 30 to 70 dB SPL in 20 dB steps as indicated by increasing line thickness. Signal duration was 100 ms and was repeated every 200 ms, 20 times. In each instance, the carrier frequency was set to CF except for the unit in A, where it was set slightly higher at 1000 Hz.
Similar articles
- Linear coding of complex sound spectra by discharge rate in neurons of the medial nucleus of the trapezoid body (MNTB) and its inputs.
Koka K, Tollin DJ. Koka K, et al. Front Neural Circuits. 2014 Dec 16;8:144. doi: 10.3389/fncir.2014.00144. eCollection 2014. Front Neural Circuits. 2014. PMID: 25565971 Free PMC article. - Anatomy and physiology of principal cells of the medial nucleus of the trapezoid body (MNTB) of the cat.
Smith PH, Joris PX, Yin TC. Smith PH, et al. J Neurophysiol. 1998 Jun;79(6):3127-42. doi: 10.1152/jn.1998.79.6.3127. J Neurophysiol. 1998. PMID: 9636113 - Auditory nerve inputs to cochlear nucleus neurons studied with cross-correlation.
Young ED, Sachs MB. Young ED, et al. Neuroscience. 2008 Jun 12;154(1):127-38. doi: 10.1016/j.neuroscience.2008.01.036. Epub 2008 Feb 5. Neuroscience. 2008. PMID: 18343587 Free PMC article. - Formation and maturation of the calyx of Held.
Nakamura PA, Cramer KS. Nakamura PA, et al. Hear Res. 2011 Jun;276(1-2):70-8. doi: 10.1016/j.heares.2010.11.004. Epub 2010 Nov 18. Hear Res. 2011. PMID: 21093567 Free PMC article. Review. - The ion channels and synapses responsible for the physiological diversity of mammalian lower brainstem auditory neurons.
Leão RM. Leão RM. Hear Res. 2019 May;376:33-46. doi: 10.1016/j.heares.2018.12.011. Epub 2018 Dec 26. Hear Res. 2019. PMID: 30606624 Review.
Cited by
- Linear coding of complex sound spectra by discharge rate in neurons of the medial nucleus of the trapezoid body (MNTB) and its inputs.
Koka K, Tollin DJ. Koka K, et al. Front Neural Circuits. 2014 Dec 16;8:144. doi: 10.3389/fncir.2014.00144. eCollection 2014. Front Neural Circuits. 2014. PMID: 25565971 Free PMC article. - Neuronal population model of globular bushy cells covering unit-to-unit variability.
Ashida G, Heinermann HT, Kretzberg J. Ashida G, et al. PLoS Comput Biol. 2019 Dec 27;15(12):e1007563. doi: 10.1371/journal.pcbi.1007563. eCollection 2019 Dec. PLoS Comput Biol. 2019. PMID: 31881018 Free PMC article. - Classification of unit types in the anteroventral cochlear nucleus of laboratory mice.
Roos MJ, May BJ. Roos MJ, et al. Hear Res. 2012 Jul;289(1-2):13-26. doi: 10.1016/j.heares.2012.04.019. Epub 2012 May 2. Hear Res. 2012. PMID: 22579638 Free PMC article. - The volley theory and the spherical cell puzzle.
Joris PX, Smith PH. Joris PX, et al. Neuroscience. 2008 Jun 12;154(1):65-76. doi: 10.1016/j.neuroscience.2008.03.002. Epub 2008 Mar 8. Neuroscience. 2008. PMID: 18424004 Free PMC article. Review. - Perfidious synaptic transmission in the guinea-pig auditory brainstem.
Stasiak A, Sayles M, Winter IM. Stasiak A, et al. PLoS One. 2018 Oct 4;13(10):e0203712. doi: 10.1371/journal.pone.0203712. eCollection 2018. PLoS One. 2018. PMID: 30286113 Free PMC article.
References
- Adams JC, Wenthold RJ. Immunostaining of ascending auditory pathways with glycine antiserum. ARO Absts. 1987;10:63.
- Blackburn CC, Sachs MB. Classification of unit response types in the anteroventral cochlear nuclei: PAT histograms and regularity analysis. J Neurophysiol. 1989;62:1303–1329. - PubMed
- Bledsoe SC, Snead CR, Helfert RH, Prasad V, Wenthold RJ, Altschuler RA. Immunocytochemical and lesion studies support the hypothesis that the projection of the medial nucleus of the trapezoid body to the lateral superior nucleus is glycinergic. Brain Res. 1990;517:189–194. - PubMed
- Bourk TR. PhD thesis. Cambridge, MA: MIT Press; 1970. Electrical Responses of neural Units in the Anteroventral Cochlear Nucleus of the cat.
Publication types
MeSH terms
LinkOut - more resources
Full Text Sources
Miscellaneous

