Basolateral junctions utilize warts signaling to control epithelial-mesenchymal transition and proliferation crucial for migration and invasion of Drosophila ovarian epithelial cells - PubMed (original) (raw)
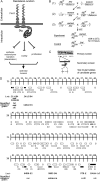
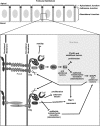
Figure 1.—
Summary of the dlg enhancer screen. (A) Model of the BLJ. Transmembrane Fas2 and scaffolding Dlg repress tumor growth and invasion (S
zafranski
and G
oode
2007). They repress three genetically separable activities, EMT, motility, and proliferation. EMT results in membrane lateralization (see text for
discussion
). (B) Cross scheme to identify dlg enhancers on the second and third chromosomes. A _d_ominant _m_arker (DM) gene, typically Gla on the second chromosome, or Dr on the third chromosome, was used to follow segregation of mutant chromosomes. The Balancer on the first chromosome was FM7a, on the second chromosome was Cyo, and on the third, TM3, Sb. In the first cross, v+Y is an insertion onto the Y chromosome of a fragment of the X chromosome that covers the dlg locus [10B6-10]. v+Y is introduced into the background of each mutant (cross 2, +/v+Y; mutant/DM) to rescue dlghf lethality in dlghf/v+Y; mutant/DM flies in cross 3. The third cross was completed at 18°, the dlghf/dlgip20 permissive temperature, to bypass dlg lethality. Experimental and control animals were recovered at 18°, then shifted to 25° for 72 ± 2 hr. The same scheme was used to construct dlghf/dlgsw; mutant/+ and dlghf/dlglv55; mutant/+ animals (see text). (C) The screen was completed in three phases. In the primary screen, we used a panel of deletions that uncover most autosomal regions (Bloomington deficiency kit,
http://flybase.bio.indiana.edu/
). In the secondary screen, we further tested each region that enhanced dlg invasion with additional deletions, to confirm or rule out the enhancing interaction and to refine the position of the interacting locus. Finally, we tested mutations located within the delineated locus to identify the enhancing gene. (D) Schematic summary of the primary screen. The figure shows 178 deficiencies assayed in the primary screen. The deficiencies uncover the genetic regions indicated by the width of the boxes. Deficiencies that scored 100% invasion are solid boxes. Deficiencies that did not enhance invasion are open boxes. The cytological limits of each enhancer locus are shown (the breakpoints are defined by the minimal region that must include the enhancing gene as determined by the pattern of overlap between all enhancing deficiencies). The gene identified as the dlg enhancer at each locus is shown.
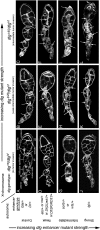
Figure 2.—
Characterization of dlg enhancer phenotypes. A–L are organized horizontally left to right by increasing dlg strength (X chromosome, dlg genotype), and vertically top to bottom by increasing dlg enhancer strength (autosome, enhancer genotype). Strings of maturing egg chambers that are representative of the indicated X chromosome; autosome genotype are shown (arrows point to tumors). (A) Control egg chambers of genotype dlgsw/dlghf; Gla/+ appear wild type. Stage 4 (s4) to s9 egg chambers are evident. Each egg chamber has 16 germ cells, 15 anterior nurse cells, and a posterior oocyte. A follicular epithelium surrounds each egg chamber. A small cluster of cells called border cells exit the anterior epithelium at stage 9 and migrates between the nurse cells to the oocyte. (B) Control egg chambers of genotype dlgip20/dlghf; Dr/+. They have small tumors that invade the germ line starting as early as stage 2 of oogenesis (arrows). (C) Control egg chambers of genotype dlglv55/dlghf; Dr/+. They have intermediate-size tumors that invade more frequently than in dlgip20/dlghf; Dr/+ animals (see text). (D, G, and J) All dlg enhancers cause tumors in dlgsw/dlghf animals that typically do not have tumors (compare to control, A). (E, H, and K) All dlg enhancers increase the frequency and size of tumors in dlgip20/dlghf animals. Whereas tumors are observed in ∼66% of dlgip20/dlghf ovarioles, they are observed in 100% of dlgip20/dlghf; enhancer/+ ovarioles, even for the weakest enhancers. (F, I, and L) In dlglv55/dlghf; enhancer/+ animals, the tumors become increasingly larger and more aggressive in appearance with increasing dlg enhancer strength, often appearing to consume the entire egg chamber in the most severe cases (L).
Figure 3.—
Quantitative analysis of dlg enhancement and suppression. (A) Frequency of dlgsw/dlghf; enhancer/+ tumor invasion. lgl causes the highest frequency, scrib and wts an intermediate frequency, and ebi and rn the lowest frequency of invasion. All enhancements were significant (**P < 0.01). (B) For all dlgip20/dlghf; enhancer/+ genotypes invasion occurs in 100% of ovarioles (Figure 2). To compare the strengths of enhancement we determined the average tumor size (
materials and methods
). Removal of one copy of lgl (dlgip20/dlghf; lgl/+) causes tumors that are four to five times the size of dlgip20/dlghf tumors, while removal of one copy of ebi, rn, scrib, or wts causes tumors that are roughly twice larger (**P < 0.01). (C) Suppression of dlglv55/dlghf tumorigenesis by dlg enhancer overexpression. The Gal4-UAS system (B
rand
and P
errimon
- was used to drive overexpression of each UAS-dlg enhancer transgene with GR1-Gal4, which is expressed in all follicle cells throughout oogenesis (S
zafranski
and G
oode
2007). dlglv55/dlghf tumorigenesis was most significantly suppressed by dlg, lgl, and wts (**P < 0.01) and to a lesser but still significant degree by scrib and roe (*P < 0.05). ebi showed no significant suppression.
Figure 4.—
Genetic interaction of dlg enhancers with Fas2null. (A) Fas2 tumors invade into the germ line (arrows). (B) Fas2; wts/+ tumors are larger, but are typically noninvasive (arrows). All Fas2; enhancer/+ animals have the same pattern of noninvasive tumors. Occasionally a few isolated cells that have broken from the main tumor are observed between the germ cells (arrowheads). (C) Tumor scores for Fas2; enhancer/+ egg chambers. All dlg enhancers enhanced Fas2 ∼6- to 10-fold, with the exception of scrib, which showed a 2-fold enhancement (**P < 0.01; *P < 0.05). (D) Suppression of Fas2 tumorigenesis by overexpression of dlg enhancers. Overexpression was accomplished as described in Figure 3C. All but ebi showed significant suppression of Fas2 tumorigenesis.
Figure 5.—
Fas2, dlg, scrib, wts, and roe enhance lgl. (A) At 25° all lgl4/lglts3 egg chambers appear wild type. (B) At 29° all lgl4/lglts3 ovarioles have one or more egg chambers with tumors. Approximately 90% of the tumors accumulate at the poles (arrows). Approximately 8% of the tumors are invasive (I). (C) dlgm52/+; lgl4/lglts3 egg chambers develop tumors at the 25° permissive temperature. Approximately 60% of these tumors are invasive (arrow, I). (D) At 29° most dlgm52/+; lgl4/lglts3 egg chambers have noninvasive tumors that are larger than the tumors in lgl4/lglts3 (arrows, compare to B). However, invasive tumors are observed at a low frequency, as for lgl4/lglts3. (E) Fas2/+; lgl4/lglts3 egg chambers develop tumors at 25°. One hundred percent of these tumors are invasive (I) and some break away from the epithelium and migrate much like a border cell cluster (arrow). (F) Fas2/+; lgl4/lglts3 egg chambers at 29° causes noninvasive tumors that are typically larger than the tumors in lgl4/lglts3 at 29° alone (arrows, compare to B). However, invasive tumors are observed at a low frequency, as in lgl4/lglts3 egg chambers. (G) lgl4/lglts3; wtsX1/+ egg chambers develop invasive tumors at 25°. Approximately 40% of tumors are invasive (arrow). (H) lgl4/lglts3; wtsX1/+ egg chambers at 29° causes noninvasive tumors that are larger than the tumors in lgl4/lglts3 at 29° alone (arrows). However, invasive tumors are observed at a low frequency, as in lgl4/lglts3 egg chambers. scrib and roe showed a similar pattern of interactions (I).
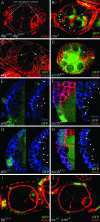
Figure 6.—
Clonal analysis of wts, scrib, roe, ft, and mer; ex. Egg chambers are stained with phalloidin to reveal actin in cellular cortexes (red). (A) Tumor cells accumulate in stratified layers at the anterior and posterior poles of dlgm35/dlgip20 egg chambers, but they do not invade. The tumor cells delaminate toward the germ line and have a rounded, mesenchymal-like morphology. (B–J) Clonal analysis of roe, wts, scrib, ft, and mer; ex. Cells without lacZ or GFP (green) are homozygous mutant for the indicated mutations. (B) roe2 causes small, noninvasive tumors that delaminate toward the germ line (arrow). Most tumors accumulate around the oocyte, but occasionally at the anterior of the egg chamber as well. More typically, anterior roe2 cells remain in the epithelium but have a rounded morphology (arrowheads), like tumor cells that have completely delaminated. (C and D) wtsX1 and scrib673 tumors are similar to dlgm35/dlgip20 tumors. (E–H) Analysis of BLJ proteins α-Spectrin and Dlg in wts and scrib follicle cells. α-Spectrin and Dlg are localized to the BLJ in the native epithelium (arrows). α-Spectrin and Dlg accumulate around the circumference of wts and scrib tumor cells (arrowheads). This lateralized phenotype is indicative of EMT (see text). (I and J) Clones of ft or mer; ex double mutant cells do not develop tumors.
Figure 7.—
Analysis of wts, scrib, and roe border cell migration. (A) A stage-9 egg chamber from the wtsx1 clonal analysis experiment without a clone (GFP is expressed in all follicle cells). The follicle cell nuclei are marked with propidium iodide (red), and the actin cortexes with phalloidin (blue). The border cell cluster (arrow) migrates in sync with the trailing edge of the follicular epithelium (TE, arrows). (B) wtsx1 clone in a stage-9 egg chamber (follicle cells without GFP, white dotted outline). The border cell cluster (arrow) remains at the anterior of the egg chamber, while the TE has almost completed migration (arrows). The two nonclone cells marked with GFP at the center of the border cell cluster are the polar cells, which help to organize the cluster and are carried along by the border cells, but do not actively migrate (S
zafranski
and G
oode
2004). (C and D) scrib673 and roe2 clones in stage-9 egg chambers. scrib673 border cell clusters (arrow) remain at the anterior of the egg chamber, while the TE has almost completed migration (arrows). roe2 has a similar, but less severe phenotype, in which the border cells typically start to migrate when the TE has moved about halfway to the oocyte.
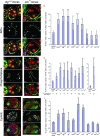
Figure 8.—
Proliferation of Fas2, dlg, lgl, scrib, wts, roe, ft, and mer; ex epithelial cells. (A and B) BrdU incorporation in dlgm52 and wtsX1 clones. dlgm52 cells are marked by absence of β-galactosidase (β-gal) and wtsX1 cells by absence of GFP. PI stains all nuclei, while BrdU labels nuclei that are in or have entered S phase during the 1-hour incubation period. A greater number of BrdU+ cells are observed in dlgm52 and wtsX1 cells compared to nonclone cells. (C) Quantitative analysis of BrdU in Fas2, dlg, lgl, scrib, wts, roe, ft, ex, and mer; ex clones. The bar graph shows the percentage of BrdU+ cells in clones divided by the percentage of BrdU+ cells in nonclones. Control clones were generated with y w P[w+, FRT 101], the parent chromosome for Fas2null and dlgm52. Control clones have a ratio of ∼1, indicating no difference in the percentage of BrdU+ cells in GFP− clone vs. GFP+ nonclone cells. In contrast, the ratio of BrdU+ cells is ∼2-fold greater for Fas2, dlg, lgl, scrib, wts, and roe cells compared to nonclone cells (**P < 0.01; *P < 0.05). ft, ex, and mer; ex cells showed a slight, insignificant decrease in the number of BrdU+ cells. (D and E) PH3 in dlgm52 and wtsX1 clones. dlgm52 cells are marked by absence of β-gal and wtsX1 cells by absence of GFP. PI stains all nuclei, while PH3 labels nuclei that are in mitosis. A greater number of PH3+ cells are observed in dlgm52 and wtsX1 cells compared to nonclone cells. (F) Quantitative analysis of PH3 in Fas2, dlg, lgl, scrib, wts and roe, ft, ex, and mer; ex clones. The bar graph shows the percentage of PH3+ cells in clones divided by the percentage of PH3+ cells in nonclones. Control clones have a ratio of ∼1, indicating no difference in the percentage of PH3+ cells in GFP− clone vs. GFP+ nonclone cells. The ratio of PH3+ cells is ∼2- to 3-fold greater for dlg, lgl, scrib, wts, roe, ft, ex, and mer; ex cells compared to nonclone cells (**P < 0.01; *P < 0.05). Fas2 showed a 10-fold increase in PH3+ cells. Only Fas2, dlg, lgl, scrib, wts, and roe cells showed highly expressive and penetrant PH3 staining after s6, when follicle cells normally stop dividing. (G and H) CycE in dlgm52 and wtsX1 clones. dlgm52 cells are marked by absence of β-gal and wtsX1 cells by absence of GFP. PI stains all nuclei, while CycE labels nuclei that are in mitosis. A greater number of CycE+ cells are observed in dlgm52 and wtsX1 cells compared to nonclone cells. (I) Quantitative analysis of CycE in Fas2, dlg, lgl, scrib, wts, and roe, ft, ex, and mer; ex clones. The bar graph shows the percentage of CycE+ cells in clones divided by the percentage of CycE+ cells in nonclones. Control clones have a ratio of ∼1.2, indicating little difference in the percentage of CycE+ cells in GFP− clone vs. GFP+ nonclone cells. The ratio of CycE+ cells is ∼2- to 3-fold greater for Fas2, dlg, wts, and roe compared to nonclone cells, while lgl and scrib showed a trend toward increased CycE expression. ft, ex, and mer; ex cells showed a significant decrease in CycE expression (**P < 0.01; *P < 0.05).
Figure 9.—
Elevated DIAP1 levels in Fas2, dlg, lgl, scrib, wts, and roe cells. Follicle cell clones are marked by the absence of β-gal or GFP. Egg chambers were stained with phalloidin to mark the cellular cortexes and with DIAP1 antibodies. DIAP1 is dramatically elevated in most mutant clone cells compared to nonclone cells. Increased DIAP1 was not observed in ft, ex, mer, or mer; ex clones (not shown).
Figure 10.—
Working model for Wts signaling from the BLJ. We propose that Dlg organizes two or more signaling complexes to repress invasive tumorigenesis. One complex includes Fas2 as a Dlg PDZ ligand. This complex includes an unknown activator of Wts (X) that represses EMT and proliferation, through regulation of Roe, CycE, DIAP1, and other unknown factors. DIAP1 promotes movement as part of a complex with Rac1, and by triggering Dlg cleavage (scissors, see text). The complex also includes Lgl and does not or only weakly interacts with Scrib (represented as a reduced intensity). Fas2–Dlg–Lgl also repress motility through an undefined pathway. A second complex has an unknown Dlg PDZ ligand (?). This complex is associated predominantly with Scrib, also includes Lgl, and represses EMT and proliferation. In addition to repressing DIAP1, Scrib may promote border cell movement by localizing Rac1, as in humans. Ex and Mer may also be involved in Wts signaling starting during midoogenesis (not shown, see text).
