Loss of microRNA cluster miR-29a/b-1 in sporadic Alzheimer's disease correlates with increased BACE1/beta-secretase expression - PubMed (original) (raw)
Loss of microRNA cluster miR-29a/b-1 in sporadic Alzheimer's disease correlates with increased BACE1/beta-secretase expression
Sébastien S Hébert et al. Proc Natl Acad Sci U S A. 2008.
Abstract
Although the role of APP and PSEN genes in genetic Alzheimer's disease (AD) cases is well established, fairly little is known about the molecular mechanisms affecting Abeta generation in sporadic AD. Deficiency in Abeta clearance is certainly a possibility, but increased expression of proteins like APP or BACE1/beta-secretase may also be associated with the disease. We therefore investigated changes in microRNA (miRNA) expression profiles of sporadic AD patients and found that several miRNAs potentially involved in the regulation of APP and BACE1 expression appeared to be decreased in diseased brain. We show here that miR-29a, -29b-1, and -9 can regulate BACE1 expression in vitro. The miR-29a/b-1 cluster was significantly (and AD-dementia-specific) decreased in AD patients displaying abnormally high BACE1 protein. Similar correlations between expression of this cluster and BACE1 were found during brain development and in primary neuronal cultures. Finally, we provide evidence for a potential causal relationship between miR-29a/b-1 expression and Abeta generation in a cell culture model. We propose that loss of specific miRNAs can contribute to increased BACE1 and Abeta levels in sporadic AD.
Conflict of interest statement
The authors declare no conflict of interest.
Figures
Fig. 1.
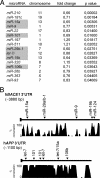
Changes in miRNA levels in sporadic AD brain. (A) Significantly changed miRNAs in cortex of sporadic AD cases. Differences (fold change, compared with controls group), P values, and chromosome localization of miRNA genes are shown. miRNAs predicted to target BACE1 and/or APP 3′UTRs identified by various algorithms: miRanda (
), Targetscan (targetscan.org), Pictar (pictar.bio.nyu.edu), and miRbase (
) are highlighted in gray. (B) Conservation plot of human BACE1 and APP 3′UTRs with putative miRNA binding sites. The percentage of conservation in four mammalian species (human, mouse, rat, and dog) is shown. bp, base pairs.
Fig. 2.
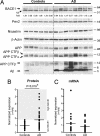
BACE1 up-regulation in sporadic AD brain. (A) Representative Western blot of BACE1 (probed with C-terminal antibody), Pen-2 (probed with B96 antibody), Nicastrin (probed with 9C3 antibody), APP full-length (probed with B63 antibody), APP CTFs (probed with B63 and WO2 antibodies), and Aβ (probed with WO2 antibody) in AD and age-matched controls is shown. β-actin was used as normalization control. Densitometric quantifications of BACE1 are shown (fold difference, average of controls = 1). (B) Densitometric quantifications of BACE1 protein levels in sporadic AD (n = 34) vs. controls (n = 21). For each gel, the average of the controls was used as reference (i.e., 1-fold). β-actin was used as normalization control. The graph mean is shown. The “AD high BACE1” subgroup is defined as 2 standard deviations from the controls group. (C) qRT-PCR of BACE1 mRNA from representative controls (n = 20) and from AD patients (n = 34). β-Actin mRNA was used as normalization control. The average of the controls was used as reference (i.e., 1-fold). The graph mean is shown. NS, nonspecific band.
Fig. 3.
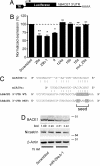
BACE1 is a miRNA target gene. (A) Schematic representation (not to scale) of the BACE1 3′UTR luciferase construct. TK, thymidine kinase promotor. Luc, luciferase gene. (B) BACE1 3′UTR (wt or mutant, see C) luciferase and Renilla luciferase constructs were transfected into HeLa cells with the indicated miRNA oligonucleotides at a final concentration of 75 nM. Normalized (to Renilla) sensor luciferase activity is shown as a percentage of the control with a scrambled oligonucleotide. Error bars represent standard deviations derived from three or more independent experiments performed in duplicate. Statistical significance between control (scrambled miR-treated) and candidate miR-treated HeLa cells was determined by a Wilcoxon test (*, P < 0.05, **, P < 0.01). (C) The sequence and putative binding sites of the miR-29a/b-1 family are shown. The miR-29a/b-1 seed sequence is highlighted in gray. In the hBACE1 3′UTR MUT construct, the binding site for miR-29a/b-1 is mutated as indicated. (D) Western blot analysis of endogenous BACE1 (probed with C-terminal antibody), Nicastrin (used as additional control) and β-actin in SK-N-SH cells treated with 75 nM (final concentration) of miR-29a/b-1. Note that cell extracts were treated with PGNase F (Roche) overnight to remove N-linked sugars before immunoblot analysis explaining the lower molecular weight of BACE1 and Nicastrin. Densitometric quantifications of BACE1 (shown as fold difference) are shown.
Fig. 4.
Misregulation of miR-29a/b-1 in AD brain. (A) miR-29a and (B) -29b-1 levels were quantified by qRT-PCR in controls, AD patients with low BACE1, AD patients with high BACE1, and non-AD dementia patients. Relative expression is shown as percentage using the mean of the controls group as reference (100% = no change in expression). The graph mean is shown. (C and D) Pearson's correlation test demonstrates significant correlation between miR-29a/b-1 and BACE1 in complete set of AD patients. Relative expression is shown as percentage using the lowest ΔCt value (here, highest miR levels) of miR-29a/b-1 as 100%. BACE1 quantifications are identical as in Fig. 2_B_. In all experiments, ubiquitously expressed miR-16 was used as normalization control for qRT-PCR. Statistical significance was determined by a Mann–Whitney test.
Fig. 5.
Developmental coregulation of miR-29a/b-1 and BACE1. (A) Western blot analysis of BACE1 (probed with C-terminal antibody) from prenatal and postnatal mouse brain. β-actin was used as loading control. (B) miR-29a, -29b, and -9 expression levels was measured by qRT-PCR from total RNA. Ribosomal nuclear RNA 19 (RNU19) was used as normalization control. Relative expression of miRNAs was calculated by using the relative quantification method (using embryonic day 17.5 as 1-fold). (C) Northern blot analysis for miR-29b-1 and -9 from total RNA. Ribosomal 5.8S was used as loading control. (D) Northern blot analysis of murine BACE1 mRNA levels. Note that the BACE1 probe recognized different mRNA transcripts, as observed (32). GAPDH was used as loading control. (E) Top and Middle: in situ hybridization signals for miR-29a or -29b-1 in total brains of 1-week- or 2-month-old wild-type mice. The green strainings represent miR-29. The blue strainings represent DAPI (nuclei). (Bottom) Immufluorescence signals (in green) for BACE1 protein (probed with C-terminal antibody) in 2-month-old mouse brain. (F) miR-29a and -29b-1 levels were measured by qRT-PCR from total RNA from primary cultured neurons, glia, mouse total brain (postnatal day 0 and 6 months) and adult human brain (cortex, n = 5, average of 54 years old). RNU19 was used as normalization control. Relative expression of miRNAs was calculated by using the relative quantification method (using HEK293 as 1-fold). (G) Western blot analysis of BACE1, MAP2 (neuronal maker), and GFAP (astrocytic marker) of primary cultured neurons and glia (same samples used in E). β-Actin was used as loading control.
Fig. 6.
Modulation of BACE1 activity by miR-29a/b-1. (A) Western blot analysis of endogenous human BACE1 (probed with 3D5 antibody) and APP-CTFs (α and β) in premiR (miR-29a/b-1) or anti-miR (miR-29a/b-1 antisense)-treated HEK293-APP-Sw cells (75 nM final concentration). APP-CTFα and β-Actin were used as loading controls. (B) Western blot analysis of secreted APP (α and β) and Aβ in premiR (miR-29a and/or miR-29b-1) treated HEK293-APP-Sw cells. Two concentrations (25 or 75 nM) are shown. Densitometric quantifications of soluble Aβ and sAPPβ are shown. The levels of sAPPα were used as normalization control. AS, antisense. (C) Western blot analysis of APP-CTFs (α and β) in premiR-29a/b-1-treated HEK293-APP-Sw cells (75 nM final concentration) alone or in combination with human BACE1 cDNA. APP-CTFα and β-actin were used as loading controls. Note that Aβ peptides were immunoprecipitated with B7 antibody before Western blot analysis with WO2. (D) Schematic representation (not to scale) of human APP 695 isoform and its cleavage sites by α-, β-, and γ-secretases. The β-secretase Glu-11 cleavage site is indicated with a “*” sign. Epitopes from the antibodies used in this study are indicated.
Similar articles
- Amyloid-β protein (Aβ) Glu11 is the major β-secretase site of β-site amyloid-β precursor protein-cleaving enzyme 1(BACE1), and shifting the cleavage site to Aβ Asp1 contributes to Alzheimer pathogenesis.
Deng Y, Wang Z, Wang R, Zhang X, Zhang S, Wu Y, Staufenbiel M, Cai F, Song W. Deng Y, et al. Eur J Neurosci. 2013 Jun;37(12):1962-9. doi: 10.1111/ejn.12235. Eur J Neurosci. 2013. PMID: 23773065 - MiR-340 Reduces the Accumulation of Amyloid-β Through Targeting BACE1 (β-site Amyloid Precursor Protein Cleaving Enzyme 1) in Alzheimer's Disease.
Tan X, Luo Y, Pi D, Xia L, Li Z, Tu Q. Tan X, et al. Curr Neurovasc Res. 2020;17(1):86-92. doi: 10.2174/1567202617666200117103931. Curr Neurovasc Res. 2020. PMID: 31957613 - The beta-secretase, BACE: a prime drug target for Alzheimer's disease.
Vassar R. Vassar R. J Mol Neurosci. 2001 Oct;17(2):157-70. doi: 10.1385/JMN:17:2:157. J Mol Neurosci. 2001. PMID: 11816789 Review. - BACE1: the beta-secretase enzyme in Alzheimer's disease.
Vassar R. Vassar R. J Mol Neurosci. 2004;23(1-2):105-14. doi: 10.1385/JMN:23:1-2:105. J Mol Neurosci. 2004. PMID: 15126696 Review.
Cited by
- Therapeutic Effects of Transplanted Exosomes Containing miR-29b to a Rat Model of Alzheimer's Disease.
Jahangard Y, Monfared H, Moradi A, Zare M, Mirnajafi-Zadeh J, Mowla SJ. Jahangard Y, et al. Front Neurosci. 2020 Jun 18;14:564. doi: 10.3389/fnins.2020.00564. eCollection 2020. Front Neurosci. 2020. PMID: 32625049 Free PMC article. - Loss of miR-29b following acute ischemic stroke contributes to neural cell death and infarct size.
Khanna S, Rink C, Ghoorkhanian R, Gnyawali S, Heigel M, Wijesinghe DS, Chalfant CE, Chan YC, Banerjee J, Huang Y, Roy S, Sen CK. Khanna S, et al. J Cereb Blood Flow Metab. 2013 Aug;33(8):1197-206. doi: 10.1038/jcbfm.2013.68. Epub 2013 May 1. J Cereb Blood Flow Metab. 2013. PMID: 23632968 Free PMC article. - MicroRNAs and the Regulation of Tau Metabolism.
Hébert SS, Sergeant N, Buée L. Hébert SS, et al. Int J Alzheimers Dis. 2012;2012:406561. doi: 10.1155/2012/406561. Epub 2012 Jun 5. Int J Alzheimers Dis. 2012. PMID: 22720189 Free PMC article. - Distinct patterns of APP processing in the CNS in autosomal-dominant and sporadic Alzheimer disease.
Pera M, Alcolea D, Sánchez-Valle R, Guardia-Laguarta C, Colom-Cadena M, Badiola N, Suárez-Calvet M, Lladó A, Barrera-Ocampo AA, Sepulveda-Falla D, Blesa R, Molinuevo JL, Clarimón J, Ferrer I, Gelpi E, Lleó A. Pera M, et al. Acta Neuropathol. 2013 Feb;125(2):201-13. doi: 10.1007/s00401-012-1062-9. Epub 2012 Dec 6. Acta Neuropathol. 2013. PMID: 23224319 Free PMC article. - MicroRNAs in Neurocognitive Dysfunctions: New Molecular Targets for Pharmacological Treatments?
Nadim WD, Simion V, Benedetti H, Pichon C, Baril P, Morisset-Lopez S. Nadim WD, et al. Curr Neuropharmacol. 2017;15(2):260-275. doi: 10.2174/1570159x14666160709001441. Curr Neuropharmacol. 2017. PMID: 27396304 Free PMC article. Review.
References
- Rovelet-Lecrux A, et al. APP locus duplication causes autosomal dominant early-onset Alzheimer disease with cerebral amyloid angiopathy. Nat Genet. 2006;38:24–26. - PubMed
- Sherrington R, et al. Cloning of a gene bearing missense mutations in early-onset familial Alzheimer's disease. Nature. 1995;375:754–760. - PubMed
- Rogaev EI, et al. Familial Alzheimer's disease in kindreds with missense mutations in a gene on chromosome 1 related to the Alzheimer's disease type 3 gene. Nature. 1995;376:775–778. - PubMed
- Annaert W, De Strooper B. A cell biological perspective on Alzheimer's disease. Annu Rev Cell Dev Biol. 2002;18:25–51. - PubMed
- Yang LB, et al. Elevated beta-secretase expression and enzymatic activity detected in sporadic Alzheimer disease. Nat Med. 2003;9:3–4. - PubMed
Publication types
MeSH terms
Substances
LinkOut - more resources
Full Text Sources
Other Literature Sources
Medical


