Widespread receptivity to neuropeptide PDF throughout the neuronal circadian clock network of Drosophila revealed by real-time cyclic AMP imaging - PubMed (original) (raw)
Widespread receptivity to neuropeptide PDF throughout the neuronal circadian clock network of Drosophila revealed by real-time cyclic AMP imaging
Orie T Shafer et al. Neuron. 2008.
Abstract
The neuropeptide PDF is released by sixteen clock neurons in Drosophila and helps maintain circadian activity rhythms by coordinating a network of approximately 150 neuronal clocks. Whether PDF acts directly on elements of this neural network remains unknown. We address this question by adapting Epac1-camps, a genetically encoded cAMP FRET sensor, for use in the living brain. We find that a subset of the PDF-expressing neurons respond to PDF with long-lasting cAMP increases and confirm that such responses require the PDF receptor. In contrast, an unrelated Drosophila neuropeptide, DH31, stimulates large cAMP increases in all PDF-expressing clock neurons. Thus, the network of approximately 150 clock neurons displays widespread, though not uniform, PDF receptivity. This work introduces a sensitive means of measuring cAMP changes in a living brain with subcellular resolution. Specifically, it experimentally confirms the longstanding hypothesis that PDF is a direct modulator of most neurons in the Drosophila clock network.
Figures
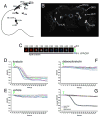
Figure 1
Epac1-camps is stably expressed in the neuronal circadian clock network and retains its function as a cAMP reporter. A. Schematic representation of nine classes of circadian clock neurons in a single hemisphere of the adult brain. B. Anterior aspect confocal Z-series of YFP emission in a uas-Epac1-camps(42A);Cry(39)-Gal4 brain (scale bar = 100μM). Visible neuronal clock classes are labeled, as are neurons of the ellipsoid body (eb). C. A pseudo-colored time-course of Epac1-camps FRET loss in a single l-vLN cell body in response to 10μM FSK. The black bar beneath the panels indicates the presence of FSK. The look-up table values represent un-normalized YFP/CFP ratios. D. The responses of 14 l-vLNs from five brains to 10μM FSK. In all graphs the green triangles indicate the start of bath application. E. The responses of 14 l-vLNs from five brains to vehicle (0.1% DMSO in HL3 Saline). F. The responses of 15 l-vLNs from five brains to 10μM ddFSK, a biologically inactive form of FSK. G. Summary plots of the data in D-F displaying the average YFP/CFP value for each time-point. In this and all other figures, error bars indicate the standard error of the mean (SEM). Data were analyzed through one-way repeated measures ANOVA with fixed factor drug (vehicle, FSK, ddFSK) and within-subjects factor time. The ANOVA revealed a significant within-subjects effect of time on the measurement of the normalized ratio (p<0.001), and a significant effect of the drug used on the ratio recorded (p<0.001). Finally, FSK, vehicle, and ddFSK can be broken into two homogenous subsets: FSK and Vehicle/ddFSK, which are homogenous statistically.
Figure 2
The s-vLNs of pdf(M)-Gal4/uas-Epac1-camps(42A) flies display a pronounced loss of FRET in response to 10−5M PDF. A-F. FRET plots for the cell bodies of l-vLNs and s-vLNs in vehicle- and PDF-treated brains. A. FRET plots for eleven l-vLNs from four brains treated with vehicle. Green triangles indicate the start of bath-application. B. FRET plots for 12 l-vLNs from four brains treated with 10−5M PDF. C. Average FRET plots for l-vLNs of brains treated with vehicle and PDF. D. FRET plots for eight s-vLNs from four brains treated with vehicle. E. FRET plots for ten s-vLNs from five brains treated with 10−5M PDF. F. Average FRET plots for s-vLNs of brains treated with vehicle and PDF. A two-way, repeated-measures ANOVA was performed on these data with fixed factors cell type (l-vLNs versus s-vLNs) and peptide (PDF versus vehicle) using all time measurements as within-subjects factors. There was a significant within-subject effect of time (p<0.001), a significant between-subjects effect of the cell type (p<0.001), and PDF was significantly different than vehicle (p<0.001).
Figure 3
PDF-induced loss of Epac1-camps FRET is dependent on the PDF concentration and is reversible; the neuropeptide DH31 triggers similar effects. A. Average plots of FRET following bath-application of various concentrations of PDF in the s-vLNs of Pdf(m)-Gal4;uas-Epac1-camps(50A) brains. Green triangles represent the start of peptide exposure. The effects of different PDF concentrations were compared by repeated measures ANOVA using PDF concentration as the fixed factor. This test indicated a significant effect of the PDF concentration on FRET Loss over time (p>0.001). B. A comparison of average maximum Epac1-camps FRET loss in response of increasing concentrations of PDF from the same experiment shown in (A). Maximum FRET loss was determined for each neuron as shown in figure S2. A single factor ANOVA revealed that PDF concentration had a significant effect on the level of maximum FRET loss (p<0.001). C. Average FRET plots for s-vLNs from Pdf(m)-Gal4;uas-Epac1-camps(50A) brains treated with 10−6 M PDF or vehicle. The plots are based on 14 neurons from 14 brains for PDF treatment and five neurons from five brains for vehicle. Images were captured every 15 seconds. D. Time-course of FRET for the cells shown in (C) following washout of PDF, or mock-washout in which the original 10−6 M PDF was removed then immediately re-introduced. Vehicle-treated cells from (C) were also imaged following a rinse identical to that for the washout. The plots are based on nine neurons from nine brains for washout, five neurons from five brains for mock washout, and five neurons from five brains for vehicle. Time-points were taken every 15 seconds. A repeated measures ANOVA revealed a significant effect of washout (p=0.002) and that PDF washout cells were statistically homogenous with control cells by Tukey HSD. E. Average plots of FRET in s-vLNs of Pdf(m)-Gal4;uas-Epac1-camps(50A) brains following exposure to one of a suite of fly and vertebrate peptides at 10−6 M. Error bars have been omitted to display all plots with clarity. Application of both PDF (magenta) and DH31 (light blue) resulted in pronounced loss of FRET in the s-vLNs. A one-way repeated measures ANOVA was performed. Though there was a significant effect of peptide treatment (p<0.001), only the PDF and DH 31 treatments were statistically distinct from controls by Tukey HSD. F. Average plots of FRET in l-vLNs of Pdf(m)-Gal4;uas-Epac1-camps(50A) brains following exposure to one of a suite of fly and vertebrate peptides at 10−6 M. Error bars have been omitted to display all plots with clarity. A one-way repeated measures ANOVA was performed. Though there was a significant effect of peptide treatment (p<0.001), only the DH 31 and dromyosuppressin (DMS) treatments were statistically distinct from controls by Tukey HSD. The data summarized in (E) and (F) are based on observations on five to 14 neurons of each class from three to five brains for each peptide. Individual plots for vehicle-, PDF-, and DH31-treated l-vLNs and s-vLNs are shown in Figure S4.
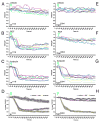
Figure 4
The response to PDF in the s-vLNs requires PDFr. A. FRET plots for ten w1118; pdf(bmrj)-Gal4/uas-Epac1-camps(50A) (wild-type) s-vLNs from five brains treated with vehicle. Green triangles indicate the start of bath-application. B. FRET plots for 13 wild-type s-vLNs from six brains treated with 10−5M PDF. C. FRET plots for eight wild-type s-vLNs from five brains treated with 10μM FSK. D. Average FRET plots for vehicle, PDF, and FSK application in wild-type brains. Both PDF and FSK induced pronounced FRET loss. E. FRET plots for 11 han5304; pdf-Gal4/uas-Epac1-camps(50A) (pdfr mutant) s-vLNs from five brains treated with vehicle. F. FRET plots for 14 pdfr mutant s-vLNs from six brains treated with 10−5M PDF. G. FRET plots for 13 pdfr mutant s-vLNs from five brains treated with 10μM FSK. H. Average FRET plots for vehicle, PDF, and FSK application in pdfr mutants. A two-way repeated measures ANOVA using genotype and drug/peptide treatment as fixed factors revealed a significant effect of genotype and drug, as well as a significant interaction (i.e. the genotypes are both affected by the drugs, but in different ways). The means across all values of time of the three drug treatments are statistically distinct (i.e. control is different from FSK which is different from PDF).
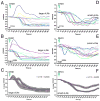
Figure 5
Responsiveness to DH31 in the l-vLNs and s-vLNs does not require PDFr, but is reduced in the s-vLNs of the pdfr mutant han5304. A. Epac1-camps FRET plots for 15 control [_w1118/y; pdf-Gal4/uas-Epac1-camps(50A)_] l-vLNs from six brains treated with 10−6M DH31. Green triangles indicate the start of bath-application. B. Epac1-camps FRET plots for ten han5304/y; pdf-Gal4/uasEpac1-camps(50A) (pdfr mutant) l-vLNs from six brains treated with 10−6M DH31. C. Average plots of the DH31 response of the l-vLNs of wild-type and pdfr mutant brains. D. Epac1-camps FRET plots for 11 control s-vLNs from five brains treated with 10−6M DH31. E. Epac1-camps FRET plots for 15 pdfr mutant s-vLNs from seven brains treated with 10−6M DH31. F. Average Epac1-camps FRET plots response of the s-vLNs of wild-type and pdfr mutant brains. Despite the clear trend toward reduced FRET loss in the s-vLNs of pdfr mutants, a repeated measures two-way ANOVA with main effects factors genotype and neuronal type found no significant effect of genotype (p=0.571). There was a marginally significant interaction (p=0.056) indicating that the trend in FRET response behavior differs between l-vLNs and s-vLNs is reversed for the two genotypes considered (w1118 and han5304).
Figure 6
uas-driven PDFr expression confers pronounced PDF responsiveness upon the l-vLNs and increases the PDF response of the s-vLNs. A. FRET plots of 21 Pdf(m)-Gal4;uas-Epac1-camps(50A)/Cyo (control) l-vLNs from 10 brains treated with 10−5M PDF. Green triangles indicate the time of bath-application. B. FRET plots of 25 Pdf(M)-Gal4/uas-Epac1-camps(50A)/uas-PDFr(16L) (PDFr over-expressing) l-vLNs from 11 brains treated with 10−5M PDF. C. Average FRET plots from wild-type and PDFr-overexpressing (uas-PDFr) l-vLNs. D. FRET plots of 20 wild-type s-vLNs from 10 brains treated with 10−5M PDF. E. FRET plots of 23 PDFr over-expressing s-vLNs from 12 brains treated with 10−5M PDF. F. Average FRET plots from control and PDFr-overexpressing s-vLNs. A two-way repeated measures ANOVA with factors cell-type and PDFr expression revealed a significant effect of all between-subjects factors (PDFr, and cell type) and a significant interaction indicating that the two cell types responded differently to PDFr overexpression.
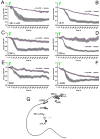
Figure 7
All classes of PDF-negative _Cry(39)-Gal4_-positive clock neurons display increased cAMP in response to 10−5M PDF. The response of the 5th s-vLN was tested in uas-Epac1-camps(42A);Cry(39)-Gal4/Pdf-Gal80 males. All other clock neurons were tested in uas-Epac1-camps(42A);Cry(39)-Gal4 males. A. Average plots of Epac1-camps FRET in the 5th s-vLNs following bath application of 10−5M PDF or vehicle. Green triangles represent start of bath application. B. Average plots of Epac1-camps FRET in dLNs following bath application of 10−5M PDF or vehicle. C. Average plots of Epac1-camps FRET in the DN1a following bath application of 10−5M PDF or vehicle. D. Average plots of Epac1-camps FRET in the DN1p following bath-application of 10−5M PDF or vehicle. E. Average plots of Epac1-camps FRET in the DN2 following bath-application of 10−5M PDF or vehicle. F. Average plots of Epac1-camps FRET in the l-DN3 following bath-application of 10−5M PDF or vehicle. Individual cell responses for the different circadian cell groups are shown in the following Figures: 5th s-vLN (S6A and B); dLN (S6C and D); DN1a (S7A and B); DN1p (S7C and D); DN2 (S7E and F); large-DN3 (S7G and H). G. A schematic representation of PDF receptivity throughout eight classes of circadian clock neuron. Black cells indicate the neurons that displayed consistent FRET loss in response to PDF in this study. Grey cells indicate neurons that displayed little or no responses to PDF. The small DN3 cells were not tested. Data were analyzed by two-way repeated measures ANOVA with factors cell-type and PDF treatment. There was a significant effect of both main effects factors (PDF versus vehicle; pacemaker cell type, p<0.001 in both cases) on Epac1-camps FRET of all cell classes. A significant interaction (p=0.031) suggests that the pacemaker cells respond differently to PDF application.
Figure 8
Confocal imaging of Epac1-camps FRET following bath application of 10−5M PDF in the s-vLNs, l-vLNs, and DN2s. A. Epac1-camps FRET plots for eleven s-vLNs from seven Pdf(m)-Gal4;uas-Epac1-camps(50A) brains treated with vehicle. B. Epac1-camps FRET plots for 14 s-vLNs from seven Pdf(m)-Gal4;uas-Epac1-camps(50A) brains treated with 10−5M PDF. C. Average Epac1-camps FRET plots response of the s-vLN to vehicle (magenta) and PDF (blue), imaged with the confocal. D. Epac1-camps FRET plots for 12 l-vLNs from seven Pdf(m)-Gal4;uas-Epac1-camps(50A) brains treated with vehicle. E. Epac1-camps FRET plots for 20 l-vLNs from ten Pdf(m)-Gal4;uas-Epac1-camps(50A) brains treated with 10−5M PDF. F. Average Epac1-camps FRET plots response of the l-vLN to vehicle and PDF, imaged with the confocal. Data for the s- and l-vLNs were analyzed by repeated measures ANOVA with two fixed factors: cell-type and PDF treatment. This test revealed a significant effect of 10−5M PDF as well as a significant effect of neuronal type. In addition, there was a significant (p=0.01) interaction between neuronal type and peptide treatment indicating that the different neuronal types respond differently to 10−5M PDF. G. Epac1-camps FRET plots for nine DN2s from seven uas-Epac1-camps(42A);Cry(39)-Gal4 brains treated with vehicle. H. Epac1-camps FRET plots for ten DN2s from six uas-Epac1-camps(42A);Cry(39)-Gal4 brains treated with 10−5M PDF. I. Average Epac1-camps FRET plots response of the DN2s to vehicle and PDF, imaged with the confocal. A one-way repeated measures ANOVA revealed that the effect of PDF on the DN2s was highly significant (p=0.001).
Comment in
- Cyclic AMP imaging sheds light on PDF signaling in circadian clock neurons.
Tomchik SM, Davis RL. Tomchik SM, et al. Neuron. 2008 Apr 24;58(2):161-3. doi: 10.1016/j.neuron.2008.04.008. Neuron. 2008. PMID: 18439399
Similar articles
- Drosophila GPCR Han is a receptor for the circadian clock neuropeptide PDF.
Hyun S, Lee Y, Hong ST, Bang S, Paik D, Kang J, Shin J, Lee J, Jeon K, Hwang S, Bae E, Kim J. Hyun S, et al. Neuron. 2005 Oct 20;48(2):267-78. doi: 10.1016/j.neuron.2005.08.025. Neuron. 2005. PMID: 16242407 - Phase coupling of a circadian neuropeptide with rest/activity rhythms detected using a membrane-tethered spider toxin.
Wu Y, Cao G, Pavlicek B, Luo X, Nitabach MN. Wu Y, et al. PLoS Biol. 2008 Nov 4;6(11):e273. doi: 10.1371/journal.pbio.0060273. PLoS Biol. 2008. PMID: 18986214 Free PMC article. - PDF and cAMP enhance PER stability in Drosophila clock neurons.
Li Y, Guo F, Shen J, Rosbash M. Li Y, et al. Proc Natl Acad Sci U S A. 2014 Apr 1;111(13):E1284-90. doi: 10.1073/pnas.1402562111. Epub 2014 Mar 18. Proc Natl Acad Sci U S A. 2014. PMID: 24707054 Free PMC article. - Downloading central clock information in Drosophila.
Park JH. Park JH. Mol Neurobiol. 2002 Oct-Dec;26(2-3):217-33. doi: 10.1385/MN:26:2-3:217. Mol Neurobiol. 2002. PMID: 12428757 Review. - Mechanisms of clock output in the Drosophila circadian pacemaker system.
Taghert PH, Shafer OT. Taghert PH, et al. J Biol Rhythms. 2006 Dec;21(6):445-57. doi: 10.1177/0748730406293910. J Biol Rhythms. 2006. PMID: 17107935 Review.
Cited by
- The molecular ticks of the Drosophila circadian clock.
Tataroglu O, Emery P. Tataroglu O, et al. Curr Opin Insect Sci. 2015 Feb 1;7:51-57. doi: 10.1016/j.cois.2015.01.002. Curr Opin Insect Sci. 2015. PMID: 26120561 Free PMC article. - A new player in circadian networks: Role of electrical synapses in regulating functions of the circadian clock.
Iyer AR, Sheeba V. Iyer AR, et al. Front Physiol. 2022 Nov 3;13:968574. doi: 10.3389/fphys.2022.968574. eCollection 2022. Front Physiol. 2022. PMID: 36406999 Free PMC article. Review. - cAMP Signals in Drosophila Motor Neurons Are Confined to Single Synaptic Boutons.
Maiellaro I, Lohse MJ, Kittel RJ, Calebiro D. Maiellaro I, et al. Cell Rep. 2016 Oct 25;17(5):1238-1246. doi: 10.1016/j.celrep.2016.09.090. Cell Rep. 2016. PMID: 27783939 Free PMC article. - Analysis of functional neuronal connectivity in the Drosophila brain.
Yao Z, Macara AM, Lelito KR, Minosyan TY, Shafer OT. Yao Z, et al. J Neurophysiol. 2012 Jul;108(2):684-96. doi: 10.1152/jn.00110.2012. Epub 2012 Apr 25. J Neurophysiol. 2012. PMID: 22539819 Free PMC article. - Regulation of Olfactory Associative Memory by the Circadian Clock Output Signal Pigment-Dispersing Factor (PDF).
Flyer-Adams JG, Rivera-Rodriguez EJ, Yu J, Mardovin JD, Reed ML, Griffith LC. Flyer-Adams JG, et al. J Neurosci. 2020 Nov 18;40(47):9066-9077. doi: 10.1523/JNEUROSCI.0782-20.2020. Epub 2020 Oct 26. J Neurosci. 2020. PMID: 33106351 Free PMC article.
References
- Abe H, Kato Y, Chihara K, Iwasaki Y, Imura H. Central effect of somatostatin on the secretion of growth hormone in the anesthetized rat. Proc Soc Exp Biol Med. 1981;159:346– 349. - PubMed
- Beaudet A, Greenspun D, Raelson J, Tannenbaum GS. Patterns of expression of SSTR1 and SSTR2 somatostatin receptor subtypes in the hypothalamus of the adult rat: relationship to neuroendocrine function. Neuroscience. 1995;65:551–561. - PubMed
- Blanchardon E, Grima B, Klarsfeld A, Chélot E, Hardin PE, Préat T, Rouyer F. Defining the role of Drosophila lateral neurons in the control of circadian rhythms in motor activity and eclosion by targeted genetic ablation and PERIOD protein overexpression. Eur J Neurosci. 2001;13:871–888. - PubMed
- Bos JL. Epac: a new cAMP target and new avenues in cAMP research. Nat Rev Mol Cell Biol. 2003;4:733–738. - PubMed
Publication types
MeSH terms
Substances
Grants and funding
- P30 NS057105/NS/NINDS NIH HHS/United States
- R01 MH067122/MH/NIMH NIH HHS/United States
- MH067122/MH/NIMH NIH HHS/United States
- R01 MH067122-04/MH/NIMH NIH HHS/United States
- R01 NS021749-21/NS/NINDS NIH HHS/United States
- R01 MH067122-05/MH/NIMH NIH HHS/United States
- F32 NS053222/NS/NINDS NIH HHS/United States
- P30 NS057105-039005/NS/NINDS NIH HHS/United States
- 2F32NS053222-02/NS/NINDS NIH HHS/United States
- R01 NS021749/NS/NINDS NIH HHS/United States
- NS057105/NS/NINDS NIH HHS/United States
- NS21749/NS/NINDS NIH HHS/United States
LinkOut - more resources
Full Text Sources
Other Literature Sources
Molecular Biology Databases


