Starting structure dependence of NMR order parameters derived from MD simulations: implications for judging force-field quality - PubMed (original) (raw)
Starting structure dependence of NMR order parameters derived from MD simulations: implications for judging force-field quality
Alrun N Koller et al. Biophys J. 2008 Jul.
Abstract
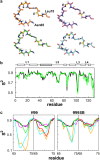
Comparing experimental generalized N-H S(2) order parameters to those calculated from molecular dynamics trajectories is increasingly used to judge force-field quality and completeness of sampling. Herein we demonstrate for the well-investigated system hen egg white lysozyme that different experimental starting structures can lead to significant differences in molecular-dynamics-derived S(2) parameters that can be even larger than S(2) parameter deviations due to different force fields. Caution should thus be taken in general when simulated S(2) parameters are compared to experimental data with the aim of judging force-field quality. We show that adequately sampling flexible regions ( approximately 100 ns) and only calculating S(2) parameters averaged over short time windows proved necessary to obtain consistent results irrespective of the starting structure.
Figures
FIGURE 1
(a) Residues 65–75 (loop 2) of the investigated HEWL structures (1HEL (orange, cluster 1); 1E8L model 1 (cyan, cluster 1); 1IEE (green, cluster 2); and 6LYT (magenta, cluster 4)). The N atoms of Gly71 and Asn74 are colored in yellow. Additionally, it is indicated if the N-H bond points to the protein (p) or to the solvent (s). (b) Experimental _S_2 values (18) (black) are compared to calculated values (green) from the 30 ns simulation of 1IEE with ff99SB. Secondary structure elements are indicated by boxes (white, helix; gray, _β_-sheet). (c) Comparison of experimental (18) (black) and calculated _S_2 values (colored as in a) of loop 2 using ff99 and ff99SB. The _S_2 values were either calculated over the whole 30 ns trajectory (left panels) or averaged over time windows of 1 ns length (right panels). The red line depicts 1 ns time window-averaged _S_2 values of 1HEL over 100 ns.
Similar articles
- Validation of the GROMOS force-field parameter set 45Alpha3 against nuclear magnetic resonance data of hen egg lysozyme.
Soares TA, Daura X, Oostenbrink C, Smith LJ, van Gunsteren WF. Soares TA, et al. J Biomol NMR. 2004 Dec;30(4):407-22. doi: 10.1007/s10858-004-5430-1. J Biomol NMR. 2004. PMID: 15630561 - Importance of the CMAP correction to the CHARMM22 protein force field: dynamics of hen lysozyme.
Buck M, Bouguet-Bonnet S, Pastor RW, MacKerell AD Jr. Buck M, et al. Biophys J. 2006 Feb 15;90(4):L36-8. doi: 10.1529/biophysj.105.078154. Epub 2005 Dec 16. Biophys J. 2006. PMID: 16361340 Free PMC article. - Molecular dynamics simulation of proteins under high pressure: Structure, function and thermodynamics.
Hata H, Nishiyama M, Kitao A. Hata H, et al. Biochim Biophys Acta Gen Subj. 2020 Feb;1864(2):129395. doi: 10.1016/j.bbagen.2019.07.004. Epub 2019 Jul 11. Biochim Biophys Acta Gen Subj. 2020. PMID: 31302180 Review.
Cited by
- Starting-structure dependence of nanosecond timescale intersubstate transitions and reproducibility of MD-derived order parameters.
Zeiske T, Stafford KA, Friesner RA, Palmer AG 3rd. Zeiske T, et al. Proteins. 2013 Mar;81(3):499-509. doi: 10.1002/prot.24209. Epub 2012 Dec 24. Proteins. 2013. PMID: 23161667 Free PMC article. - Synergistic applications of MD and NMR for the study of biological systems.
Fisette O, Lagüe P, Gagné S, Morin S. Fisette O, et al. J Biomed Biotechnol. 2012;2012:254208. doi: 10.1155/2012/254208. Epub 2012 Jan 26. J Biomed Biotechnol. 2012. PMID: 22319241 Free PMC article. Review. - Routine Microsecond Molecular Dynamics Simulations with AMBER on GPUs. 1. Generalized Born.
Götz AW, Williamson MJ, Xu D, Poole D, Le Grand S, Walker RC. Götz AW, et al. J Chem Theory Comput. 2012 May 8;8(5):1542-1555. doi: 10.1021/ct200909j. Epub 2012 Mar 26. J Chem Theory Comput. 2012. PMID: 22582031 Free PMC article. - Evaluating the performance of the ff99SB force field based on NMR scalar coupling data.
Wickstrom L, Okur A, Simmerling C. Wickstrom L, et al. Biophys J. 2009 Aug 5;97(3):853-6. doi: 10.1016/j.bpj.2009.04.063. Biophys J. 2009. PMID: 19651043 Free PMC article. - Uncertainty Quantification in Alchemical Free Energy Methods.
Bhati AP, Wan S, Hu Y, Sherborne B, Coveney PV. Bhati AP, et al. J Chem Theory Comput. 2018 Jun 12;14(6):2867-2880. doi: 10.1021/acs.jctc.7b01143. Epub 2018 May 2. J Chem Theory Comput. 2018. PMID: 29678106 Free PMC article.
References
- Case, D. A. 2002. Molecular dynamics and NMR spin relaxation in proteins. Acc. Chem. Res. 35:325–331. - PubMed
- Brüschweiler, R. 2003. New approaches to the dynamic interpretation and prediction of NMR relaxation data from proteins. Curr. Opin. Struct. Biol. 13:175–183. - PubMed
- Smith, L. J., A. E. Mark, C. M. Dobson, and W. F. van Gunsteren. 1995. Comparison of MD simulations and NMR experiments for hen lysozyme. Analysis of local fluctuations, cooperative motions, and global changes. Biochemistry. 34:10918–10931. - PubMed
- Lipari, G., and A. Szabo. 1982. Model-free approach to the interpretation of nuclear magnetic resonance relaxation in macromolecules. 1. Theory and range of validity. J. Am. Chem. Soc. 104:4546–4559.
- Showalter, S. A., and R. Brüschweiler. 2007. Validation of molecular dynamics simulations of biomolecules using NMR spin relaxation as benchmarks: application to the AMBER99SB force field. J. Chem. Theory Comput. 3:961–975. - PubMed
Publication types
MeSH terms
Substances
LinkOut - more resources
Full Text Sources
Miscellaneous
