The reticulon and DP1/Yop1p proteins form immobile oligomers in the tubular endoplasmic reticulum - PubMed (original) (raw)
The reticulon and DP1/Yop1p proteins form immobile oligomers in the tubular endoplasmic reticulum
Yoko Shibata et al. J Biol Chem. 2008.
Abstract
We recently identified a class of membrane proteins, the reticulons and DP1/Yop1p, which shape the tubular endoplasmic reticulum (ER) in yeast and mammalian cells. These proteins are highly enriched in the tubular portions of the ER and virtually excluded from other regions. To understand how they promote tubule formation, we characterized their behavior in cellular membranes and addressed how their localization in the ER is determined. Using fluorescence recovery after photobleaching, we found that yeast Rtn1p and Yop1p are less mobile in the membrane than normal ER proteins. Sucrose gradient centrifugation and cross-linking analyses show that they form oligomers. Mutants of yeast Rtn1p, which no longer localize exclusively to the tubular ER or are even totally inactive in inducing ER tubules, are more mobile and oligomerize less extensively. The mammalian reticulons and DP1 are also relatively immobile and can form oligomers. The conserved reticulon homology domain that includes the two membrane-embedded segments is sufficient for the localization of the reticulons to the tubular ER, as well as for their diffusional immobility and oligomerization. Finally, ATP depletion in both yeast and mammalian cells further decreases the mobilities of the reticulons and DP1. We propose that oligomerization of the reticulons and DP1/Yop1p is important for both their localization to the tubular domains of the ER and for their ability to form tubules.
Figures
FIGURE 1.
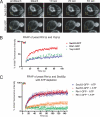
Rtn1p and Yop1p have slow diffusional mobility in the ER of yeast cells. A, typical FRAP of Sec63-GFP or Rtn1-GFP in S. cerevisiae cells expressed at endogenous levels. Images were taken before and then after the photobleach for the times indicated. The boxed region shows the area that was photobleached. B, fluorescence intensities normalized to prebleach values of FRAP analyses on yeast Sec63-GFP, Rtn1-GFP, and Yop1-GFP were plotted over time. Error bars indicate ± S.E.; n = 4 cells. C, fluorescence intensities normalized to prebleach values plotted over time of FRAP analyses on yeast Rtn1p in ATP-depleted (green) or non-depleted (orange) cells, compared with that of Sec63p-GFP (ATP depleted in blue; non-depleted in red). Error bars indicate ± S.E., n = 4 cells.
FIGURE 2.
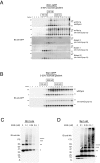
Yeast Rtn1p and Yop1p form homo-oligomers in the membrane. A, membranes isolated from wild-type or _rtn1_Δ_rtn2_Δ_yop1_Δ (NDY257) yeast cells expressing wild-type or mutant forms of Rtn1-GFP at endogenous levels were solubilized in 1% digitonin, fractionated by 5–30% w/v sucrose gradient centrifugation, and analyzed by SDS-PAGE and immunoblotting with anti-GFP antibody. Note that the mutant forms of Rtn1p have peak migrations at a smaller molecular weight than the wild-type protein. B, membranes isolated from wild-type or _rtn1_Δ_rtn2_Δ_yop1_Δ yeast cells expressing wild-type Yop1-GFP at endogenous levels were solubilized in 1% digitonin and were analyzed as in A. Molecular weight standards in the sucrose gradient are as indicated. C, isolated membranes of yeast cells expressing Rtn1-His were treated with increasing concentrations of EGS and analyzed on SDS-PAGE, and oligomers were visualized by immunoblotting with anti-His antibody. D, membranes of yeast cells expressing Yop1-HA were analyzed as in C and immunoblotted with anti-HA antibody. Asterisks, number of monomeric copies of the specified protein as seen by SDS-PAGE.
FIGURE 3.
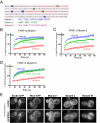
A yeast Rtn1p mutant with defects in localization and oligomerization also cannot shape tubules in vivo. A, mutations in Rtn1 Mutant 1, Mutant 2, and Mutant 91 that affect the ability of the protein to localize exclusively to the tubular ER. The residues altered in Mutant 1 are shown in blue, and those in Mutant 2 are shown in green. K48I is responsible for the altered localization of Mutant 2. The combined mutations of Mutant 91 are indicated in purple. The two membrane-embedded regions are indicated in red. B–D, fluorescence intensities normalized to prebleach values plotted over time from FRAP analyses of Rtn1-GFP Mutant 1 (B), Mutant 2 (C), or Mutant 91 (D) expressed in wild-type S. cerevisiae cells. Error bars indicate ± S.E., n = 4–8 cells. E, the indicated GFP fusions were constitutively expressed under their endogenous promoters in _rtn1_Δ_rtn2_Δ_yop1_Δ cells. The ER was visualized by focusing on either the center or periphery of the cell. Note that wild-type, Mutant 1, and Mutant 2 Rtn1-GFP restore tubular ER structure, whereas Mutant 91 and the control protein Sec63-GFP do not.
FIGURE 4.
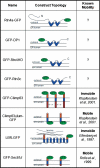
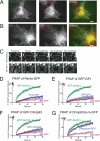
Mammalian GFP-fused membrane proteins and their known lateral mobilities used for FRAP analysis.
FIGURE 5.
Mammalian Rtn4a-GFP and GFP-DP1 have slow, restricted lateral mobilities in ER tubules. A and B, Rtn4a-GFP and GFP-DP1 (both in green) expressed in COS-7 cells localize only to the tubular ER, whereas a normal resident ER membrane protein, RFP-Sec61β (red) localizes to all ER subdomains, including the nuclear envelope and peripheral sheets. C, fluorescence recovery of GFP-DP1 compared with the control membrane protein GFP-Sec61β. Images were taken before and then after the photobleach for the times indicated. The boxed region shows the area that was photobleached. D, quantitation of FRAP analyses of Rtn4a-GFP (blue; n = 7 cells) compared with GFP-Sec61β (green; n = 6) and LBR-GFP (red; n = 3), where the average fluorescence intensity normalized to prebleach values was plotted over time. E, quantitation of FRAP analyses of GFP-DP1 (blue; n = 9) compared with GFP-Sec61β (green) and LBR-GFP (red). F, quantitation of FRAP analyses of GFP-Climp63, an ER membrane protein known to be immobile through homo-oligomerization (blue; n = 6), compared with GFP-Sec61β (green) and LBR-GFP (red). G, quantitation of FRAP analyses of Climp63Δlum-GFP, a mutant form of Climp63 lacking its luminal homo-oligomerization domain (blue; n = 5), compared with GFP-Sec61β (green) and LBR-GFP (red). All error bars indicate ± S.E.
FIGURE 6.
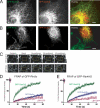
The conserved RHD is sufficient for the diffusional immobility of the mammalian reticulons. A and B, exclusive tubular ER localization of GFP-Rtn4HD and GFP-Rtn3c (both in green), two reticulon isoforms containing only the conserved reticulon homology domain, compared with the general membrane protein RFP-Sec61β (red) when expressed in COS-7 cells. C, typical FRAP experiments performed in COS-7 cells comparing the fluorescence recovery of GFP-Rtn3c to GFP-Sec61β illustrates that reticulons containing only the RHD is relatively immobile. Images were taken before and then after the photobleach for the times indicated. The boxed region shows the area that was photobleached. D, quantitation of FRAP analyses of GFP-Rtn3c (blue; n = 6) compared with GFP-Sec61β (green) and LBR-GFP (red), where fluorescence intensities normalized to prebleach values were plotted over time. E, quantitation of FRAP analyses of GFP-Rtn4HD (blue; n = 14), compared with GFP-Sec61β (green) and LBR-GFP (red). All error bars indicate ± S.E.
FIGURE 7.
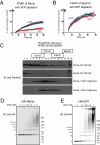
The reticulons and DP1 form oligomers in higher eukaryotes. A, quantitated FRAP analyses of mammalian GFP-Rtn3c under ATP-depleted (red, n = 7) or non-depleted (blue, n = 14) conditions. B, mammalian Sec61β-GFP under ATP-depleted (red, n = 9) or non-depleted (blue, n = 6) conditions. FRAP data from ATP-depleted cells were compared with those from non-treated cells from Fig. 6. C, Xenopus membranes solubilized in either 1.25% digitonin or 2% Nonidet P-40 were fractionated by 10–30% w/v sucrose gradient centrifugation, analyzed by SDS-PAGE, and immunoblotted with antibody against Xenopus Rtn4. Molecular weight standards in the sucrose gradient are as indicated. D, isolated membranes of COS-7 cells expressing HA-DP1 or HA-Rtn3c were treated with increasing concentrations of EGS, analyzed on SDS-PAGE, and immunoblotted with anti-HA antibody. Asterisks, number of monomers cross-linked.
FIGURE 8.
Overexpression of a reticulon stabilizes the tubular ER in the absence of microtubules in mammalian cells. A, a typical COS-7 cell expressing GFP-Sec61β (green), where microtubules have been depolymerized by nocodazole treatment (immunostained with anti-αtubulin, red), has collapsed, sheet-like peripheral ER. The lower row of panels shows an enlargement of the boxed region from the top panels. B, a typical COS-7 cell expressing GFP-Rtn3c (green) after microtubule depolymerization (stained in red) leads to an accumulation of bright foci containing Rtn3c but also retains much more tubular ER. The lower row of panels shows an enlargement of the boxed region from the top panels. Scale bar, 10 μm.
Similar articles
- A class of membrane proteins shaping the tubular endoplasmic reticulum.
Voeltz GK, Prinz WA, Shibata Y, Rist JM, Rapoport TA. Voeltz GK, et al. Cell. 2006 Feb 10;124(3):573-86. doi: 10.1016/j.cell.2005.11.047. Cell. 2006. PMID: 16469703 - ER network formation requires a balance of the dynamin-like GTPase Sey1p and the Lunapark family member Lnp1p.
Chen S, Novick P, Ferro-Novick S. Chen S, et al. Nat Cell Biol. 2012 Jun 24;14(7):707-16. doi: 10.1038/ncb2523. Nat Cell Biol. 2012. PMID: 22729086 Free PMC article. - Membrane proteins of the endoplasmic reticulum induce high-curvature tubules.
Hu J, Shibata Y, Voss C, Shemesh T, Li Z, Coughlin M, Kozlov MM, Rapoport TA, Prinz WA. Hu J, et al. Science. 2008 Feb 29;319(5867):1247-50. doi: 10.1126/science.1153634. Science. 2008. PMID: 18309084 - ER structure and function.
Chen S, Novick P, Ferro-Novick S. Chen S, et al. Curr Opin Cell Biol. 2013 Aug;25(4):428-33. doi: 10.1016/j.ceb.2013.02.006. Epub 2013 Mar 13. Curr Opin Cell Biol. 2013. PMID: 23478217 Free PMC article. Review. - Molecular basis for sculpting the endoplasmic reticulum membrane.
Lin S, Sun S, Hu J. Lin S, et al. Int J Biochem Cell Biol. 2012 Sep;44(9):1436-43. doi: 10.1016/j.biocel.2012.05.013. Epub 2012 May 26. Int J Biochem Cell Biol. 2012. PMID: 22640864 Review.
Cited by
- Endoplasmic reticulum structure and interconnections with other organelles.
English AR, Voeltz GK. English AR, et al. Cold Spring Harb Perspect Biol. 2013 Apr 1;5(4):a013227. doi: 10.1101/cshperspect.a013227. Cold Spring Harb Perspect Biol. 2013. PMID: 23545422 Free PMC article. Review. - Fine Structure of Plasmodesmata-Associated Membrane Bodies Formed by Viral Movement Protein.
Atabekova AK, Golyshev SA, Lezzhov AA, Skulachev BI, Moiseenko AV, Yastrebova DM, Andrianova NV, Solovyev ID, Savitsky AP, Morozov SY, Solovyev AG. Atabekova AK, et al. Plants (Basel). 2023 Dec 7;12(24):4100. doi: 10.3390/plants12244100. Plants (Basel). 2023. PMID: 38140427 Free PMC article. - Direct association of the reticulon protein RTN1A with the ryanodine receptor 2 in neurons.
Kaya L, Meissner B, Riedl MC, Muik M, Schwarzer C, Ferraguti F, Sarg B, Lindner H, Schweigreiter R, Knaus HG, Romanin C, Bandtlow CE. Kaya L, et al. Biochim Biophys Acta. 2013 Jun;1833(6):1421-33. doi: 10.1016/j.bbamcr.2013.02.012. Epub 2013 Feb 27. Biochim Biophys Acta. 2013. PMID: 23454728 Free PMC article. - The nanoscale organization of reticulon 4 shapes local endoplasmic reticulum structure in situ.
Fuentes LA, Marin Z, Tyson J, Baddeley D, Bewersdorf J. Fuentes LA, et al. bioRxiv [Preprint]. 2023 Jan 27:2023.01.26.525608. doi: 10.1101/2023.01.26.525608. bioRxiv. 2023. PMID: 36747764 Free PMC article. Updated. Preprint. - Reciprocal regulation between lunapark and atlastin facilitates ER three-way junction formation.
Zhou X, He Y, Huang X, Guo Y, Li D, Hu J. Zhou X, et al. Protein Cell. 2019 Jul;10(7):510-525. doi: 10.1007/s13238-018-0595-7. Epub 2018 Nov 29. Protein Cell. 2019. PMID: 30498943 Free PMC article.
References
- Staehelin, L. A. (1997) Plant J. 11 1151-1165 - PubMed
- Baumann, O., and Walz, B. (2001) Int. Rev. Cytol. 205 149-214 - PubMed
- Estrada de Martin, P., Novick, P., and Ferro-Novick, S. (2005) Biochem. Cell Biol. 83 752-761 - PubMed
- Shibata, Y., Voeltz, G. K., and Rapoport, T. A. (2006) Cell 126 435-439 - PubMed
Publication types
MeSH terms
Substances
LinkOut - more resources
Full Text Sources
Other Literature Sources
Molecular Biology Databases
Research Materials
