The optokinetic reflex as a tool for quantitative analyses of nervous system function in mice: application to genetic and drug-induced variation - PubMed (original) (raw)
The optokinetic reflex as a tool for quantitative analyses of nervous system function in mice: application to genetic and drug-induced variation
Hugh Cahill et al. PLoS One. 2008.
Abstract
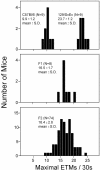
The optokinetic reflex (OKR), which serves to stabilize a moving image on the retina, is a behavioral response that has many favorable attributes as a test of CNS function. The OKR requires no training, assesses the function of diverse CNS circuits, can be induced repeatedly with minimal fatigue or adaptation, and produces an electronic record that is readily and objectively quantifiable. We describe a new type of OKR test apparatus in which computer-controlled visual stimuli and streamlined data analysis facilitate a relatively high throughput behavioral assay. We used this apparatus, in conjunction with infrared imaging, to quantify basic OKR stimulus-response characteristics for C57BL/6J and 129/SvEv mouse strains and for genetically engineered lines lacking one or more photoreceptor systems or with an alteration in cone spectral sensitivity. A second generation (F2) cross shows that the characteristic difference in OKR frequency between C57BL/6J and 129/SvEv is inherited as a polygenic trait. Finally, we demonstrate the sensitivity and high temporal resolution of the OKR for quantitative analysis of CNS drug action. These experiments show that the mouse OKR is well suited for neurologic testing in the context of drug discovery and large-scale phenotyping programs.
Conflict of interest statement
Competing Interests: The authors have declared that no competing interests exist.
Figures
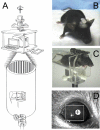
Figure 1. OKR apparatus and testing arrangement.
(A) The mouse is held in a horizontal acrylic cylinder within a large cylindrical drum. A small transparent zone in the wall of the drum allows an infrared (IR) light source and camera (bottom, in foreground) to monitor eye movements. The stimulus is controlled by a laptop computer and a projector, both of which sit approximately two meters above the drum on a rotating table that is controlled by a variable speed motor (not shown). Neutral density or chromatic filters can be placed in the light path (rectangle, at right). (B) A headposted mouse with two plastic nuts set along the anterior posterior axis. (C) A headposted mouse in position for OKR measurements rests in the acrylic cylinder with its head protruding and immobilized by an alligator clip. (D) IR image of a mouse eye showing the pupil (large upper right white circle with centered cross) and the corneal reflection (lower left white circle with centered cross). The ISCAN software has assigned the IR sink as the pupil and the IR peak as the corneal reflection.
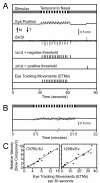
Figure 2. Stimulus, response, and data analysis during an OKR recording session with a wildtype mouse.
(A) From top to bottom, the following features are shown. The schematic of the visual stimulus over a 90 second period represents: (1) a uniform grey during the first and last 30 second of the recording period, and (2) a pattern of black and white vertical stripes (each stripe subtending 4°) rotating at 5° per second in a temporal to nasal direction (with respect to the eye that is imaged) during the middle 30 seconds of the recording period. “Eye Position” indicates the horizontal difference between the center of the pupil and the center of the corneal reflection which shows a slow and uniform temporal-to-nasal motion interrupted approximately every two seconds by a rapid nasal-to-temporal saccade. N, nasal; T, temporal. The first derivative of eye position is shown above a pair of traces that indicate the times at which the first derivative exhibits an excursion below or above negative or positive thresholds, respectively. At the bottom are the assignments of discrete eye-tracking movements (ETMs) during the 30 second stimulus interval scored by inspection of eye position and its first derivative; the rightmost suprathreshold negative excursion on the first derivative plot is not counted as an ETM because it occurred outside of the 30 second stimulus interval. An identical ETM assignment was made by NeuralWorks Predict Version 3.13, a neural network (NeuralWare, Carnegie PA). (B) OKR over a continuous 21 minute period of rotating vertical black and white stripes shows essentially no adaptation. (C) ETMs per 30 second interval vs. the relative velocity of the slow component for C57BL/6J and 129/SvEv. Each data point is derived from a single 30-second stimulus interval obtained from the experimental data presented in Figure 5. A best fitting straight line is superimposed.
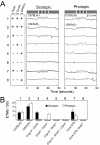
Figure 3. Photoreceptor subtypes subserving the scotopic and photopic OKR.
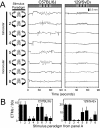
(A) Scotopic (0.3 average lux) and photopic (200 average lux) stimuli consisting of the standard rotating black and white vertical stripes were presented to mice with the indicated functional (+) or silenced/absent (−) photoreceptors. ipRGC, intrinsically photosensitive retinal ganglion cells. Genotypes are shown beneath panel (B). The photopic stimulus is the same as the standard stimulus shown in Figure 2; the scotopic version was created from it by placing neutral density filters in front of the projector. 129/SvEv and C57BL/6J lines (rows 1 and 2) show characteristically different numbers of ETMs/second; lines with targeted gene mutations (rows 3–6 and 8) are maintained on mixed C57BL/6J×129/SvEv backgrounds. (B) Quantification of ETMs/30 seconds for the 8 lines of mice tested in panel (A). Mean +/− standard deviation for 5–12 mice per line and >31 30-second stimulus intervals per line.
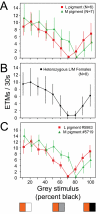
Figure 4. Chromatic sensitivity of the OKR in mice with different cone photopigments.
(A) Number of ETMs (mean +/− standard deviation) per 30-second interval for each of ten stimuli consisting of alternating orange and grey vertical stripes, with each stripe subtending 4°. The image was rotated at 5° per second. For the ten different stimuli, the orange intensity was held constant and the grey intensity was varied in 10% intensity steps from white (stimulus 1) to black (stimulus 10) as shown by the three representative panels at the bottom of the figure. The responses are from seven Gnat1−/−;M pigment mice and six Gnat1−/−;L pigment mice. Each point represents 9–20 30-second stimulus intervals per condition. The interpolated grey intensity that yields the fewest ETMs per 30 seconds provides the best estimate of the psychophysical null point. (B) As for panel (A) but averaged data from eight Gnat1−/−;M pigment/L pigment heterozygous female mice. (C) As for panel (A), but the responses are from a single Gnat1−/−;M pigment mouse and a single Gnat1−/−;L pigment mouse.
Figure 5. The sensitivity of the OKR in 129/SvEv and C57BL/6J mice to variations in contrast, spatial frequency, and angular velocity.
For each of the three stimulus parameters examined, examples of OKR recordings are shown for both 129/SvEv and C57BL/6J (upper panels) and the mean +/− standard deviations of those responses for 4–9 mice per genotype and 11–46 30-second stimulus intervals (lower panels). Unless otherwise indicated the stimulus parameters match those shown in Figure 2. (A) Contrast sensitivity. The standard black and white striped stimulus (Figure 2; 100% contrast) was modified by producing a weighted average between the black and white stripes and a standard grey with a luminance midway between that of the black and white stripes. This operation creates stripes with contrasts ranging from 0% to 100% without changing the average luminance of the stimulus. (B) Spatial frequency. The width of each black and white stripe varied from 0.67° to 45°. (C) Angular velocity. The angular velocity of the standard stimulus varied from 2° per second to 13° per second.
Figure 6. The sensitivity of the OKR in 129/SvEv and C57BL/6J mice to monocular or binocular rotation in temporal-to-nasal or nasal-to-temporal directions.
(A) Left, schematic of the geometry of the stimulus. The OKR is always recorded from the right eye, and standard stimulus parameters are used (Figure 2). Rows 1 and 2 show responses to standard clockwise or counterclockwise rotation. Rows 3 and 4 show the nulling of mirror symmetric temporal-to-nasal or nasal-to-temporal stimuli. Rows 5 and 6 show the strong response to monocular stimuli in the temporal-to-nasal direction delivered to either the contralateral or ipsilateral eye. Rows 7 and 8 show the weak response to monocular stimuli in the nasal-to-temporal direction delivered to either the contralateral or ipsilateral eye. For monocular moving stimuli (rows 5–8), an intensity-matched uniform grey stimulus was delivered to the contralateral eye. (B) Quantifying the number of ETMs/30 seconds for the stimuli tested in panel (A). Mean +/− standard deviation for >6 mice for each strain and 25–39 30-second stimulus intervals per condition. N, nasal; T, temporal.
Figure 7. Polygenic inheritance of the number of ETMs per 30-second stimulus interval.
The maximal number of ETMs per 30-second stimulus interval, determined from 16 trials per mouse, was measured for cohorts of C57BL/6J, 129/SvEv, C57BL/6J×129/SvEv F1 hybrids, and F2 progeny of the F1 hybrids. The number of animals tested, and the means and standard deviations are indicated for each distribution.
Figure 8. Time course of alterations in the OKR following IP ketamine injection into 129/SvEv mice.
(A) Each 15 second ETM record (upper panels), obtained at the indicated time before or after a 75 mg/kg IP ketamine injection, is shown above a histogram of eye positions during the same 15 second interval (lower panels). The histograms were calculated using eye position values sampled at 60 Hz and processed as described under Experimental Procedures. (B) Average and standard deviation of the number of ETMs per 30-second interval following IP ketamine at time 0 (N = 5 mice). For panels (B) and (C), the first 30-second interval following ketamine injection begins 15–20 seconds after injection. (C) Average and standard deviation of the standard deviation of eye position for each 30-second interval following IP ketamine at time 0 (N = 5 mice). (D) A systematic distortion in the shape of the slow component of the OKR between 45 and 90 seconds after ketamine injection (“post-ketamine”). The left-most data points in each curve correspond to the start of the slow phase. Note the enlarged time scale on the horizontal axis. (N = 22–24 ETMs/averaged curve, obtained from 3 mice.)
Similar articles
- Adaptive Acceleration of Visually Evoked Smooth Eye Movements in Mice.
Kodama T, du Lac S. Kodama T, et al. J Neurosci. 2016 Jun 22;36(25):6836-49. doi: 10.1523/JNEUROSCI.0067-16.2016. J Neurosci. 2016. PMID: 27335412 Free PMC article. - Combined action of optokinetic reflex (OKR) and vestibulo-ocular reflex (VOR) in macaque monkey during transient stimulation.
Schweigart G, Mergner T. Schweigart G, et al. Neurosci Lett. 1995 Oct 20;199(2):123-6. doi: 10.1016/0304-3940(95)12037-5. Neurosci Lett. 1995. PMID: 8584239 - Comparison of plasticity and development of mouse optokinetic and vestibulo-ocular reflexes suggests differential gain control mechanisms.
Faulstich BM, Onori KA, du Lac S. Faulstich BM, et al. Vision Res. 2004 Dec;44(28):3419-27. doi: 10.1016/j.visres.2004.09.006. Vision Res. 2004. PMID: 15536010 - Comparative neurobiology of the optokinetic reflex.
Masseck OA, Hoffmann KP. Masseck OA, et al. Ann N Y Acad Sci. 2009 May;1164:430-9. doi: 10.1111/j.1749-6632.2009.03854.x. Ann N Y Acad Sci. 2009. PMID: 19645943 Review. - LTD, RP, and Motor Learning.
Hirano T, Yamazaki Y, Nakamura Y. Hirano T, et al. Cerebellum. 2016 Feb;15(1):51-53. doi: 10.1007/s12311-015-0698-0. Cerebellum. 2016. PMID: 26160222 Review.
Cited by
- Effects of Chronic and Acute Intraocular Pressure Elevation on Scotopic and Photopic Contrast Sensitivity in Mice.
van der Heijden ME, Shah P, Cowan CS, Yang Z, Wu SM, Frankfort BJ. van der Heijden ME, et al. Invest Ophthalmol Vis Sci. 2016 Jun 1;57(7):3077-87. doi: 10.1167/iovs.16-19312. Invest Ophthalmol Vis Sci. 2016. PMID: 27286365 Free PMC article. - Melanopsin signalling in mammalian iris and retina.
Xue T, Do MT, Riccio A, Jiang Z, Hsieh J, Wang HC, Merbs SL, Welsbie DS, Yoshioka T, Weissgerber P, Stolz S, Flockerzi V, Freichel M, Simon MI, Clapham DE, Yau KW. Xue T, et al. Nature. 2011 Nov 2;479(7371):67-73. doi: 10.1038/nature10567. Nature. 2011. PMID: 22051675 Free PMC article. - Mechanisms underlying vestibulo-cerebellar motor learning in mice depend on movement direction.
Voges K, Wu B, Post L, Schonewille M, De Zeeuw CI. Voges K, et al. J Physiol. 2017 Aug 1;595(15):5301-5326. doi: 10.1113/JP274346. Epub 2017 Jul 10. J Physiol. 2017. PMID: 28586131 Free PMC article. - Norrin, frizzled-4, and Lrp5 signaling in endothelial cells controls a genetic program for retinal vascularization.
Ye X, Wang Y, Cahill H, Yu M, Badea TC, Smallwood PM, Peachey NS, Nathans J. Ye X, et al. Cell. 2009 Oct 16;139(2):285-98. doi: 10.1016/j.cell.2009.07.047. Cell. 2009. PMID: 19837032 Free PMC article. - Diagnosis of colour vision deficits using eye movements.
Taore A, Lobo G, Turnbull PR, Dakin SC. Taore A, et al. Sci Rep. 2022 May 11;12(1):7734. doi: 10.1038/s41598-022-11152-5. Sci Rep. 2022. PMID: 35562176 Free PMC article.
References
- Picciotto MR, Wickman K. Using knockout and transgenic mice to study neurophysiology and behavior. Physiol Rev. 1998;78:1131–1163. - PubMed
- Brunner D, Nestler E, Leahy E. In need of high-throughput behavioral systems. Drug Discovery Today. 2002;7:S107–S112. - PubMed
- Tecott LH, Nestler EJ. Neurobehavioral assessment in the information age. Nat Neurosci. 2004;7:462–466. - PubMed
- Crabbe JC, Morris RG. Festina lente: late-night thoughts on high-throughput screening of mouse behavior. Nat Neurosci. 2004;7:1175–1179. - PubMed
- Mancall EM. Philadelphia: F.A. Davis; 1982. Essentials of the Neurologic Examination (second edition). p. 228.
Publication types
MeSH terms
Substances
LinkOut - more resources
Full Text Sources
Other Literature Sources
Molecular Biology Databases
Miscellaneous
