A Raft-derived, Pak1-regulated entry participates in alpha2beta1 integrin-dependent sorting to caveosomes - PubMed (original) (raw)
A Raft-derived, Pak1-regulated entry participates in alpha2beta1 integrin-dependent sorting to caveosomes
Mikko Karjalainen et al. Mol Biol Cell. 2008 Jul.
Abstract
We have previously shown that a human picornavirus echovirus 1 (EV1) is transported to caveosomes during 2 h together with its receptor alpha2beta1 integrin. Here, we show that the majority of early uptake does not occur through caveolae. alpha2beta1 integrin, clustered by antibodies or by EV1 binding, is initially internalized from lipid rafts into tubulovesicular structures. These vesicles accumulate fluid-phase markers but do not initially colocalize with caveolin-1 or internalized simian virus 40 (SV40). Furthermore, the internalized endosomes do not contain glycosylphosphatidylinositol (GPI)-anchored proteins or flotillin 1, suggesting that clustered alpha2beta1 integrin does not enter the GPI-anchored protein enriched endosomal compartment or flotillin pathways, respectively. Endosomes mature further into larger multivesicular bodies between 15 min to 2 h and concomitantly recruit caveolin-1 or SV40 inside. Cell entry is regulated by p21-activated kinase (Pak)1, Rac1, phosphatidylinositol 3-kinase, phospholipase C, and actin but not by dynamin 2 in SAOS-alpha2beta1 cells. An amiloride analog, 5-(N-ethyl-N-isopropanyl) amiloride, blocks infection, causes integrin accumulation in early tubulovesicular structures, and prevents their structural maturation into multivesicular structures. Our results together suggest that alpha2beta1 integrin clustering defines its own entry pathway that is Pak1 dependent but clathrin and caveolin independent and that is able to sort cargo to caveosomes.
Figures
Figure 1.
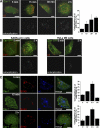
Clustered α2β1 integrin and EV1 reach caveosomes from 30 min to 2 h. (A) Colocalization of the clustered α2β1 integrin (red) with caveolin-1 (Cav-1) during integrin internalization (colocalizing voxels are presented as white). Colocalization was quantified from 30 cells from three independent experiments by using BioImageXD (see Materials and Methods). Bars, 10 μm. (B) Colocalization of EV1 or α2β1 integrin (α2) with caveolin-1 was studied in HeLa MZ and SAOS-α2β1 cells transfected with caveolin-GFP (Cav-GFP) at different time points after EV1 infection or integrin clustering. Labelings are shown as merge images (colocalizing voxels are presented as white). Bars, 10 μm. (C) SV40 was used as a marker for the caveolae pathway. SV40 accumulates with slow kinetics in caveosomes before continuing its journey to endoplasmic reticulum (ER) and nucleus. Nocodazole was used to depolymerize microtubules and block the step between caveosomes and ER to accumulate SV40 in caveosomes during 1.5-h preinternalization with SV40. Integrin α2β1 (α2; blue) was then clustered and the colocalization between internalized α2β1, SV40, and caveolin-1 was then followed for a further 5 min, 15 min, and 2 h. For the unclustered integrin control (UC) α2β1 integrin was labeled after fixation. Colocalization was quantified as described in A. Bars, 10 μm.
Figure 2.
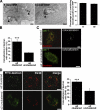
α2β1 integrin clustering sorts fluid-phase cargo to caveosomes. (A) Clustered α2β1 integrin was internalized for 5 and 15 min in the presence of 10 mg/ml HRP (left). Protein A gold (10 nm) shows the location of α2β1 integrin in tubulovesicular and multivesicular structures colocalizing with HRP after 5 and 15 min, respectively (arrowheads). Percentage of α2β1 integrin-positive endosomes (±SE) containing HRP was quantified from >200 structures. (B) Colocalization of lysine-fixable dextran (pulsed for 1 h and chased for 1 h) with caveolin-1. The assay was performed with (α2 clustered) or without (α2 unclustered) α2β1 clustering, and colocalization was quantified as described in Materials and Methods by using BioImageXD (30 cells counted from three independent experiments). Examples of cells measured for this quantification are shown in C. Colocalized voxels are shown as white color (dextran Alexa 546, red; caveolin-1, green). (D) To verify that dextran was targeted to caveosomes due to integrin clustering, colocalization between dextran (1 mg/ml FITC-dextran) and internalized SV40 was measured (quantification of colocalization was from 30 cells from 3 independent experiments). Dextran was internalized for 2 h (1-h pulse followed by 1-h chase) in the presence of nocodazole and after SV40 pretreatment for 1.5 h. Bars, 200 nm (A), 10 μm (B–D).
Figure 3.
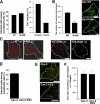
Early entry of EV1 and α2β1 integrin is not dependent on dynamin 2 and caveolin in SAOS-α2β1 cells. (A) The cells transfected with dynamin 2 constructs (wild-type, WT; DN dynamin 2, K44A) were analyzed for EV1 infection. For comparison, EV1 infection without transfection, and infection after mock transfection with yellow fluorescent protein (YFP) construct are shown. The results are mean values of three independent experiments (±SE). Transfection protocol causes a general decrease of EV1 infection (see also Figure 3B and 7B); therefore, the infectivity after transfection is always compared with the respective wild-type construct. (B) The inhibitory effect of transfected dynamin constructs on internalization of transferrin was quantified after 1-h internalization (60 cells from three experiments were quantified for the number of transferrin-containing vesicles by using a segmentation tool in BioimageXD; p < 0.001). Localization of transferrin-Alexa 488 after 1-h internalization is visualized in cells transfected with dynamin constructs. (C) Integrin α2β1 (red), unclustered (α2), or clustered for 2 h (clust. α2) is shown in transfected cells. (D) DN mutant of caveolin-3 (Cav-3 KSY) and wild-type caveolin-3 (Cav-3) were transfected to the cells and their effects on EV1 infection was quantified. The result is a mean value of two independent experiments (±SE). (E) The effect of mutant (KSY) and wild-type caveolin-3 (Cav-3) on EV1 internalization was revealed by differential labeling of the surface-bound (red and colocalized red and green voxels) and intracellular EV1 (green alone) in transfected cells after 2-h internalization (see Materials and Methods for details). (F) The internalization of α2β1 integrin in cells transfected with another DN mutant of caveolin-3 (DGV) or wild-type caveolin-3 was quantified using the internalization tool in BioimageXD. For the internalization, 30 cells from three experiments were counted for each case. Bars, 10 μm.
Figure 4.
From the plasma membrane rafts α2β1 integrin enters first simple tubulovesicular structures, which quickly mature to multivesicular bodies devoid of GPI-GFP and CTxB. (A) Expressed GPI-GFP (green; after 4-h cycloheximide treatment, 100 μg/ml) and exogenously added CTxB (green; 1 μg/ml) were internalized in the presence of clustered α2β1 integrin (red) for different times. The colocalization of α2β1 with these markers was quantified from 30 cells from three separate experiments by evaluating the number of colocalized voxels using BioImageXD. The results are expressed as percentages of α2β1 voxels colocalizing with marker voxels (±SE). Bars, 10 μm. (B) α2β1 integrin was treated on ice with a nonfunctional integrin antibody (HAS6), followed by a clustering secondary antibody and protein A gold (10 nm), and then internalized for different times at 37°C. Structures positive for α2β1 integrin were classified for being tubulovesicular (see image for 5-min time point) or multivesicular structures (images between 15 min and 2 h). Together, 150–200 structures were calculated from different times. α2β1 integrin associated with intraluminal membranes are pointed with arrows. The relative distribution of multivesicular structures of all integrin structures is plotted on the right. Bars, 200 nm.
Figure 5.
EV1 infection is blocked by macropinocytosis inhibitors. (A) EV1 was first bound on cells on ice, nonattached virus was washed away and receptor-bound virus was allowed to internalize at 37°C for 7 h in total. The drugs (EIPA, U73122, and LY294002) were added at different times during the infection. Infected cells were counted based on the emergence of new viral capsid proteins in the cytoplasm from fluorescent labeling. The results were counted from 150 to 200 cells for each case and the experiment was repeated once with similar results (control, infection without drugs). (B) Emergence of 3D polymerase as a proof of replication startup was visualized by SDS-PAGE and Western immunoblotting. Drugs were present during the whole 7-h period. (C) The localization of EV1 capsid proteins was visualized after different drug treatments 7 h p.i. Images are confocal sections through the central area of the cells. (D) Differential staining of the internalized and surface-bound α2β1 integrin and EV1. Drugs were added 30 min before the assay, and they were present during the 2-h internalization period. EV1 or α2β1 integrin were immunolabeled before and after permeabilization to reveal the surface-bound and intracellular proteins, respectively. The surface-bound proteins show both red and colocalized voxels (green and red together), whereas green alone represents the internalized proteins. The ratio of surface/internalized EV1 or α2β1 integrin was determined using the internalization algorithm in BioImageXD software (see Materials and Methods for details). (Higher ratio means lower amount of internalization.) Bars, 10 μm.
Figure 6.
EIPA prevents maturation of tubulovesicular structures into multivesicular bodies and caveolin-1 entry to these structures. (A) EM images of internalized and clustered α2β1 integrin after 2 h with EIPA or U73122 or without drugs (CONTROL). Bars, 200 nm. The proportional distribution of α2β1 integrin in tubulovesicular versus multivesicular structures after EIPA treatment was counted from 150 to 200 structures. (B) Cells were labeled for caveolin-1 (green) and internalized α2β1 integrin (red) after 2 h. Drugs were added 30 min before the experiment. Colocalization between internalized integrin and endogenous caveolin-1 was calculated from 30 cells for each case from three independent experiments. Bars, 10 μm. (C) Immuno-EM labeling of caveolin-1 (5-nm protein A gold) and α2β1 integrin (10-nm protein A gold) after 2-h internalization in control cells or after EIPA treatment. Caveolin-1 was immunolabeled after fixation and permeabilization of the cells, whereas α2β1 integrin was immunolabeled on the plasma membrane before internalization. Arrows indicate some of the caveolin-1 labels in the sections. Bars, 200 nm.
Figure 7.
Pak1 regulates EV1/α2β1 integrin entry. (A) The effects of WT, dominant-negative (Pak1 AID), and highly kinase active (Pak1 T423E) Pak1 constructs on internalization of dextran and transferrin. Quantification of internalized dextran and transferrin is shown as the amount of internalized vesicles positive for the tracer, determined by the segmentation tool in BioimageXD. The quantification was done from 30 cells from three independent experiments (***p < 0.001) Confocal images show the expressed construct (magenta), internalized transferrin (green; 0.25 mg/ml transferrin Alexa 488) and dextran (red; 0.25 mg/ml rhodamine dextran) in cells transfected with Pak1 T423E and Pak1 AID. (B) Pak1 constructs were tested for their effect on EV1 infection. The result is a mean value of three independent experiments (±SE). Control infection without transfection (C), and infection after mock transfection (N1-YFP) is shown. (C) Confocal images after 2 h and 6 h p.i. show very low amount of virus (red) in the transfected cells (marked as dotted line; in merged images Pak1 transfected cells are labeled as green). Bars, 10 μm.
Figure 8.
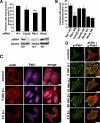
EV1 infection is regulated by Rac1 and actin dynamics. (A) RhoGTPases Cdc42, Rac1 and RhoA were knocked down using specific siRNA or control siRNA (scr) in the presence of a siGLO transfection marker. EV1 infection was quantified in these cells 6 h p.i. The result is a mean value of two independent experiments (±SE). Together, 300–400 siGLO–positive cells were counted for each construct. The knockdown effect was verified by Western blotting using tubulin as loading control. (B) The effects of Rac1, Cdc42, and RhoA were also verified by EV1 infection assay in cells transfected with WT and DN constructs. The result is a mean value of three independent experiments (±SE). (C) Pak1 (magenta) and actin (TRITC-phalloidin; red) were visualized after EV1 infection for 5 min and 2 h p.i. Bars, 10 μm. (D) Phospho Pak1 (green) was immunolabeled and actin (TRITC-phalloidin; red) was visualized after starvation (control) and EV1 treatment of SAOS-α2β1 cells for different times (between 5 min and 2 h). Bars, 10 μm.
Figure 9.
The proposed model for entry of EV1 and clustered α2β1 integrin into cell. Internalized tubulovesicular structures mature into multivesicular bodies, and they are able to fuse with internalized caveolae or caveosomal structures containing caveolin-1 and SV40. The resulting fused structures may be considered as late caveosomes.
Similar articles
- Clustering induces a lateral redistribution of alpha 2 beta 1 integrin from membrane rafts to caveolae and subsequent protein kinase C-dependent internalization.
Upla P, Marjomäki V, Kankaanpää P, Ivaska J, Hyypiä T, Van Der Goot FG, Heino J. Upla P, et al. Mol Biol Cell. 2004 Feb;15(2):625-36. doi: 10.1091/mbc.e03-08-0588. Epub 2003 Dec 2. Mol Biol Cell. 2004. PMID: 14657242 Free PMC article. - Echovirus 1 endocytosis into caveosomes requires lipid rafts, dynamin II, and signaling events.
Pietiäinen V, Marjomäki V, Upla P, Pelkmans L, Helenius A, Hyypiä T. Pietiäinen V, et al. Mol Biol Cell. 2004 Nov;15(11):4911-25. doi: 10.1091/mbc.e04-01-0070. Epub 2004 Sep 8. Mol Biol Cell. 2004. PMID: 15356270 Free PMC article. - Cholesterol dependence of collagen and echovirus 1 trafficking along the novel α2β1 integrin internalization pathway.
Siljamäki E, Rintanen N, Kirsi M, Upla P, Wang W, Karjalainen M, Ikonen E, Marjomäki V. Siljamäki E, et al. PLoS One. 2013;8(2):e55465. doi: 10.1371/journal.pone.0055465. Epub 2013 Feb 5. PLoS One. 2013. PMID: 23393580 Free PMC article. - Caveosomes and endocytosis of lipid rafts.
Nichols B. Nichols B. J Cell Sci. 2003 Dec 1;116(Pt 23):4707-14. doi: 10.1242/jcs.00840. J Cell Sci. 2003. PMID: 14600257 Review. - Caveolae/raft-dependent endocytosis.
Nabi IR, Le PU. Nabi IR, et al. J Cell Biol. 2003 May 26;161(4):673-7. doi: 10.1083/jcb.200302028. J Cell Biol. 2003. PMID: 12771123 Free PMC article. Review.
Cited by
- BioImageXD: an open, general-purpose and high-throughput image-processing platform.
Kankaanpää P, Paavolainen L, Tiitta S, Karjalainen M, Päivärinne J, Nieminen J, Marjomäki V, Heino J, White DJ. Kankaanpää P, et al. Nat Methods. 2012 Jun 28;9(7):683-9. doi: 10.1038/nmeth.2047. Nat Methods. 2012. PMID: 22743773 - Macropinocytotic uptake and infection of human epithelial cells with species B2 adenovirus type 35.
Kälin S, Amstutz B, Gastaldelli M, Wolfrum N, Boucke K, Havenga M, DiGennaro F, Liska N, Hemmi S, Greber UF. Kälin S, et al. J Virol. 2010 May;84(10):5336-50. doi: 10.1128/JVI.02494-09. Epub 2010 Mar 17. J Virol. 2010. PMID: 20237079 Free PMC article. - Extracellular Albumin and Endosomal Ions Prime Enterovirus Particles for Uncoating That Can Be Prevented by Fatty Acid Saturation.
Ruokolainen V, Domanska A, Laajala M, Pelliccia M, Butcher SJ, Marjomäki V. Ruokolainen V, et al. J Virol. 2019 Aug 13;93(17):e00599-19. doi: 10.1128/JVI.00599-19. Print 2019 Sep 1. J Virol. 2019. PMID: 31189702 Free PMC article. - 6-Thioguanine Inhibits Herpes Simplex Virus 1 Infection of Eyes.
Chen D, Liu Y, Zhang F, You Q, Ma W, Wu J, Wu Z. Chen D, et al. Microbiol Spectr. 2021 Dec 22;9(3):e0064621. doi: 10.1128/Spectrum.00646-21. Epub 2021 Nov 3. Microbiol Spectr. 2021. PMID: 34730435 Free PMC article. - Lipids in host-pathogen interactions: pathogens exploit the complexity of the host cell lipidome.
van der Meer-Janssen YP, van Galen J, Batenburg JJ, Helms JB. van der Meer-Janssen YP, et al. Prog Lipid Res. 2010 Jan;49(1):1-26. doi: 10.1016/j.plipres.2009.07.003. Epub 2009 Jul 26. Prog Lipid Res. 2010. PMID: 19638285 Free PMC article. Review.
References
- Auvinen P., Mäkelä M. J., Roivainen M., Kallajoki M., Vainionpää R., Hyypiä T. Mapping of antigenic sites of coxsackievirus B3 by synthetic peptides. APMIS. 1993;101:517–528. - PubMed
- Bonazzi M., et al. CtBP3/BARS drives membrane fission in dynamin-independent transport pathways. Nat. Cell. Biol. 2005;7:570–580. - PubMed
- Conner S. D., Schmid S. L. Regulated portals of entry into the cell. Nature. 2003;422:37–44. - PubMed
Publication types
MeSH terms
Substances
LinkOut - more resources
Full Text Sources
Other Literature Sources
Research Materials


