Overexpression of human S100B exacerbates brain damage and periinfarct gliosis after permanent focal ischemia - PubMed (original) (raw)
Overexpression of human S100B exacerbates brain damage and periinfarct gliosis after permanent focal ischemia
Takashi Mori et al. Stroke. 2008 Jul.
Abstract
Background and purpose: We have previously demonstrated that augmented and prolonged activation of astrocytes detrimentally influences both the subacute and chronic phases of cerebral ischemia. Furthermore, we have suggested that the astrocyte-derived protein S100B may be important in these pathogenic events. However, the causal relationship between S100B and exacerbation of brain damage in vivo remains to be elucidated.
Methods: Using transgenic mice overexpressing human S100B (Tg huS100B mice), we examined whether S100B plays a cardinal role in aggravation of brain damage after permanent middle cerebral artery occlusion (pMCAO).
Results: Tg huS100B mice had significantly larger infarct volumes and worse neurological deficits at any time point examined after pMCAO as compared with CD-1 background strain-matched control mice. Infarct volumes in Tg huS100B mice were significantly increased from 1 to 3 and 5 days after pMCAO (delayed infarct expansion), whereas those in control mice were not significantly altered. S100, glial fibrillary acidic protein, and Iba1 burdens in the periinfarct area were significantly increased through to 7 days after pMCAO in Tg huS100B mice, whereas those in control mice reached a plateau at 3 days after pMCAO.
Conclusions: These results provide genetic evidence that overexpression of human S100B acts to exacerbate brain damage and periinfarct reactive gliosis (astrocytosis and microgliosis) during the subacute phase of pMCAO.
Figures
Figure 1
Infarct expansion after pMCAO is S100B transgene-dependent. Infarct volumes are shown at 1, 3, 5, and 7 days after pMCAO in Tg huS100B and CD-1 mice. **P<0.01, ***P<0.001 (versus CD-1 mice); ##P<0.01 (versus 1 day).
Figure 2
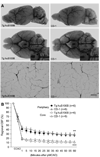
A, There are no remarkable differences between 2 lines of mice in terms of the circle of Willis, anterior cerebral artery, middle cerebral artery, posterior cerebral artery, or microvessels, except for a minor variation of the branching angle. Both of the posterior communicating arteries are detected in 2 lines of mice (inset). Arrowhead, posterior communicating artery; PCA, posterior cerebral artery; BA, basilar artery. Scale bar=50 µm. B, Regional cerebral blood flow after pMCAO in Tg huS100B and CD-1 mice. Statistical analysis revealed a within-each line of mice main effect of time after pMCAO (***P<0.001 for the core, **P<0.01 for the periphery). CCAO indicates common carotid artery occlusion; CBF, cerebral blood flow.
Figure 3
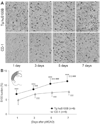
A, Expression of S100 in the periinfarct areas. In both lines of mice, S100 immunoreactivity appears to be enhanced at 3, 5, and 7 days versus 1 day after pMCAO. Most importantly, S100 immunoreactivity appears to be more pronounced in Tg huS100B mice versus CD-1 mice at all time points after pMCAO. Scale bar=50 µm. B, Five open rectangles in the inset of the coronal brain section diagram designate the regions of interest. ***P<0.001 (versus CD-1 mice); †††_P_≤0.001 (versus 1 day); ###P<0.001 (versus 3 days).
Figure 4
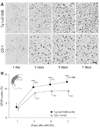
A, Expression of GFAP in the periinfarct areas. GFAP immunoreactivity appears to be enhanced at 3, 5, and 7 days versus 1 day after pMCAO in both lines of mice. Most importantly, GFAP immunoreactivity appears to be more prominent in Tg huS100B mice versus CD-1 mice at 3, 5, and 7 days after pMCAO. Scale bar=50 µm. B, Five open rectangles in the inset of the coronal brain section diagram designate the regions of interest. ***P_≤0.001 (versus CD-1 mice); †††_P<0.001 (versus 1 day); ###P<0.001 (versus 3 days).
Figure 5
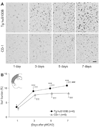
A, Expression of Iba1 in the periinfarct areas. Iba1 immunoreactivity appears to be enhanced at 3, 5, and 7 days versus 1 day after pMCAO in both lines of mice. Most importantly, Iba1 immunoreactivity appears to be more prominent in Tg huS100B mice versus CD-1 mice at 3, 5, and 7 days after pMCAO. Scale bar=50 µm. B, Five open rectangles in the inset of the coronal brain section diagram designate the regions of interest. ***P_≤0.001 (versus CD-1 mice); †††_P<0.001 (versus 1 day); ###P<0.001 (versus 3 days).
Similar articles
- Overexpression of human S100B exacerbates cerebral amyloidosis and gliosis in the Tg2576 mouse model of Alzheimer's disease.
Mori T, Koyama N, Arendash GW, Horikoshi-Sakuraba Y, Tan J, Town T. Mori T, et al. Glia. 2010 Feb;58(3):300-14. doi: 10.1002/glia.20924. Glia. 2010. PMID: 19705461 Free PMC article. - Astrocytic activation and delayed infarct expansion after permanent focal ischemia in rats. Part I: enhanced astrocytic synthesis of s-100beta in the periinfarct area precedes delayed infarct expansion.
Matsui T, Mori T, Tateishi N, Kagamiishi Y, Satoh S, Katsube N, Morikawa E, Morimoto T, Ikuta F, Asano T. Matsui T, et al. J Cereb Blood Flow Metab. 2002 Jun;22(6):711-22. doi: 10.1097/00004647-200206000-00010. J Cereb Blood Flow Metab. 2002. PMID: 12045670 - Arundic acid (ONO-2506) ameliorates delayed ischemic brain damage by preventing astrocytic overproduction of S100B.
Asano T, Mori T, Shimoda T, Shinagawa R, Satoh S, Yada N, Katsumata S, Matsuda S, Kagamiishi Y, Tateishi N. Asano T, et al. Curr Drug Targets CNS Neurol Disord. 2005 Apr;4(2):127-42. doi: 10.2174/1568007053544084. Curr Drug Targets CNS Neurol Disord. 2005. PMID: 15857298 Review. - S100B protein in the gut: the evidence for enteroglial-sustained intestinal inflammation.
Cirillo C, Sarnelli G, Esposito G, Turco F, Steardo L, Cuomo R. Cirillo C, et al. World J Gastroenterol. 2011 Mar 14;17(10):1261-6. doi: 10.3748/wjg.v17.i10.1261. World J Gastroenterol. 2011. PMID: 21455324 Free PMC article. Review.
Cited by
- Hypoxia and the Receptor for Advanced Glycation End Products (RAGE) Signaling in Cancer.
Taneja S, Vetter SW, Leclerc E. Taneja S, et al. Int J Mol Sci. 2021 Jul 29;22(15):8153. doi: 10.3390/ijms22158153. Int J Mol Sci. 2021. PMID: 34360919 Free PMC article. Review. - Flow Cytometric Characterization of T Cell Subsets and Microglia After Repetitive Mild Traumatic Brain Injury in Rats.
Bai R, Gao H, Han Z, Huang S, Ge X, Chen F, Lei P. Bai R, et al. Neurochem Res. 2017 Oct;42(10):2892-2901. doi: 10.1007/s11064-017-2310-0. Epub 2017 Jun 15. Neurochem Res. 2017. PMID: 28620825 Free PMC article. - Immunological Landscape of Retinal Ischemia-Reperfusion Injury: Insights into Resident and Peripheral Immune Cell Responses.
He S, Liu C, Ren C, Zhao H, Zhang X. He S, et al. Aging Dis. 2024 Mar 1;16(1):115-36. doi: 10.14336/AD.2024.0129. Online ahead of print. Aging Dis. 2024. PMID: 38502592 Free PMC article. Review. - miR-124: A Promising Therapeutic Target for Central Nervous System Injuries and Diseases.
Xu J, Zheng Y, Wang L, Liu Y, Wang X, Li Y, Chi G. Xu J, et al. Cell Mol Neurobiol. 2022 Oct;42(7):2031-2053. doi: 10.1007/s10571-021-01091-6. Epub 2021 Apr 22. Cell Mol Neurobiol. 2022. PMID: 33886036 Free PMC article. Review. - Overexpression of human S100B exacerbates cerebral amyloidosis and gliosis in the Tg2576 mouse model of Alzheimer's disease.
Mori T, Koyama N, Arendash GW, Horikoshi-Sakuraba Y, Tan J, Town T. Mori T, et al. Glia. 2010 Feb;58(3):300-14. doi: 10.1002/glia.20924. Glia. 2010. PMID: 19705461 Free PMC article.
References
- Ridet JL, Malhotra SK, Privat A, Gage FH. Reactive astrocytes: cellular and molecular cues to biological function. Trends Neurosci. 1997;20:570–577. - PubMed
- Nedergaard M, Dirnagl U. Role of glial cells in cerebral ischemia. Glia. 2005;50:281–286. - PubMed
- Donato R. Functional roles of S100 proteins, calcium-binding proteins of the EF-hand type. Biochim Biophys Acta. 1999;1450:191–231. - PubMed
- Foerch C, Singer OC, Neumann-Haefelin T, du Mesnil de Rochemont R, Steinmetz H, Sitzer M. Evaluation of serum S100B as a surrogate marker for long-term outcome and infarct volume in acute middle cerebral artery infarction. Arch Neurol. 2005;62:1130–1134. - PubMed
- Savola O, Pyhtinen J, Leino TK, Siitonen S, Niemelä O, Hillbom M. Effects of head and extracranial injuries on serum protein S100B levels in trauma patients. J Trauma. 2004;56:1229–1234. - PubMed
Publication types
MeSH terms
Substances
Grants and funding
- K99 AG029726/AG/NIA NIH HHS/United States
- R00 AG029726/AG/NIA NIH HHS/United States
- R01 AG032432/AG/NIA NIH HHS/United States
- 1 K99 AG029726-01/AG/NIA NIH HHS/United States
LinkOut - more resources
Full Text Sources
Miscellaneous


