Confirming the phylogeny of mammals by use of large comparative sequence data sets - PubMed (original) (raw)
Comparative Study
. 2008 Sep;25(9):1795-808.
doi: 10.1093/molbev/msn104. Epub 2008 May 2.
Affiliations
- PMID: 18453548
- PMCID: PMC2515873
- DOI: 10.1093/molbev/msn104
Comparative Study
Confirming the phylogeny of mammals by use of large comparative sequence data sets
Arjun B Prasad et al. Mol Biol Evol. 2008 Sep.
Abstract
The ongoing generation of prodigious amounts of genomic sequence data from myriad vertebrates is providing unparalleled opportunities for establishing definitive phylogenetic relationships among species. The size and complexities of such comparative sequence data sets not only allow smaller and more difficult branches to be resolved but also present unique challenges, including large computational requirements and the negative consequences of systematic biases. To explore these issues and to clarify the phylogenetic relationships among mammals, we have analyzed a large data set of over 60 megabase pairs (Mb) of high-quality genomic sequence, which we generated from 41 mammals and 3 other vertebrates. All sequences are orthologous to a 1.9-Mb region of the human genome that encompasses the cystic fibrosis transmembrane conductance regulator gene (CFTR). To understand the characteristics and challenges associated with phylogenetic analyses of such a large data set, we partitioned the sequence data in several ways and utilized maximum likelihood, maximum parsimony, and Neighbor-Joining algorithms, implemented in parallel on Linux clusters. These studies yielded well-supported phylogenetic trees, largely confirming other recent molecular phylogenetic analyses. Our results provide support for rooting the placental mammal tree between Atlantogenata (Xenarthra and Afrotheria) and Boreoeutheria (Euarchontoglires and Laurasiatheria), illustrate the difficulty in resolving some branches even with large amounts of data (e.g., in the case of Laurasiatheria), and demonstrate the valuable role that very large comparative sequence data sets can play in refining our understanding of the evolutionary relationships of vertebrates.
Figures
FIG. 1.—
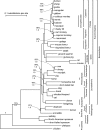
ML tree derived from the analysis of the coding sequence partition using RY-coded bases and a codon position partitioned CF + Γ model. Branch lengths indicate likelihood-inferred substitutions per site with a GTR + Γ model. ML bootstrap proportions are listed above Bayesian posterior probabilities for all branches at less than 100% bootstrap proportion and 1.0 Bayesian posterior probability support. Platypus was constrained to the mammals (its branch is marked with an asterisk to reflect this). The fishes (Tetraodon and Fugu) were used to root, but their branches are not shown. Branch lengths were optimized using ML from nucleotide-coded data with a GTR + Γ model.
FIG. 2.—
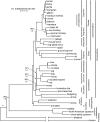
ML tree derived from the analysis of coding plus conserved noncoding sequence matrix using RY-coded bases. A CF + Γ model was used, with 4 partitions: 3 for codon positions and 1 for conserved noncoding sequence. Long branches leading to platypus and chicken were abbreviated for clarity. Other features are the same as indicated in figure 1.
FIG. 3.—
ML trees for each of 10 sequential, equal-sized partitions from the coding plus conserved noncoding sequence matrix. Numbers (1–10) reflect the specific partition used. The arrangement of taxa and branches indicated in colors other than black vary among partitions. Nodes annotated with hollow circles have less than 50% bootstrap proportions, those with shaded circles have 50% to 75% bootstrap proportions, and those with solid circles have 75% bootstrap proportions or greater. Branches that are the same in all trees are indicated in black, with some collapsed to higher level taxa for simplicity.
FIG. 4.—
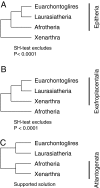
Three possible roots for Placentalia. SH test results from the coding plus conserved noncoding sequence matrix for both nucleotide- and RY-coded matrices. (A) Hypothesis rooting Placentalia between Xenarthra and Epitheria (Boreoeutheria + Afrotheria). (B) Hypothesis rooting Placentalia between Afrotheria and Exafroplacentalia (Boreoeutheria + Afrotheria). (C) Hypothesis rooting Placentalia between Boreoeutheria and Atlantogenata (Afrotheria + Xenarthra).
Similar articles
- A new phylogenetic marker, apolipoprotein B, provides compelling evidence for eutherian relationships.
Amrine-Madsen H, Koepfli KP, Wayne RK, Springer MS. Amrine-Madsen H, et al. Mol Phylogenet Evol. 2003 Aug;28(2):225-40. doi: 10.1016/s1055-7903(03)00118-0. Mol Phylogenet Evol. 2003. PMID: 12878460 - Using genomic data to unravel the root of the placental mammal phylogeny.
Murphy WJ, Pringle TH, Crider TA, Springer MS, Miller W. Murphy WJ, et al. Genome Res. 2007 Apr;17(4):413-21. doi: 10.1101/gr.5918807. Epub 2007 Feb 23. Genome Res. 2007. PMID: 17322288 Free PMC article. - Phylogenomic data analyses provide evidence that Xenarthra and Afrotheria are sister groups.
Hallström BM, Kullberg M, Nilsson MA, Janke A. Hallström BM, et al. Mol Biol Evol. 2007 Sep;24(9):2059-68. doi: 10.1093/molbev/msm136. Epub 2007 Jul 13. Mol Biol Evol. 2007. PMID: 17630282 - Mammal madness: is the mammal tree of life not yet resolved?
Foley NM, Springer MS, Teeling EC. Foley NM, et al. Philos Trans R Soc Lond B Biol Sci. 2016 Jul 19;371(1699):20150140. doi: 10.1098/rstb.2015.0140. Philos Trans R Soc Lond B Biol Sci. 2016. PMID: 27325836 Free PMC article. Review. - The chromosomes of Afrotheria and their bearing on mammalian genome evolution.
Svartman M, Stanyon R. Svartman M, et al. Cytogenet Genome Res. 2012;137(2-4):144-53. doi: 10.1159/000341387. Epub 2012 Aug 3. Cytogenet Genome Res. 2012. PMID: 22868637 Review.
Cited by
- Is Phylotranscriptomics as Reliable as Phylogenomics?
Cheon S, Zhang J, Park C. Cheon S, et al. Mol Biol Evol. 2020 Dec 16;37(12):3672-3683. doi: 10.1093/molbev/msaa181. Mol Biol Evol. 2020. PMID: 32658973 Free PMC article. - Anthropogenic environments exert variable selection on cranial capacity in mammals.
Snell-Rood EC, Wick N. Snell-Rood EC, et al. Proc Biol Sci. 2013 Aug 21;280(1769):20131384. doi: 10.1098/rspb.2013.1384. Print 2013 Oct 22. Proc Biol Sci. 2013. PMID: 23966638 Free PMC article. - Reconstructing mammalian phylogenies: a detailed comparison of the cytochrome B and cytochrome oxidase subunit I mitochondrial genes.
Tobe SS, Kitchener AC, Linacre AM. Tobe SS, et al. PLoS One. 2010 Nov 30;5(11):e14156. doi: 10.1371/journal.pone.0014156. PLoS One. 2010. PMID: 21152400 Free PMC article. - Positively selected sites in cetacean myoglobins contribute to protein stability.
Dasmeh P, Serohijos AW, Kepp KP, Shakhnovich EI. Dasmeh P, et al. PLoS Comput Biol. 2013;9(3):e1002929. doi: 10.1371/journal.pcbi.1002929. Epub 2013 Mar 7. PLoS Comput Biol. 2013. PMID: 23505347 Free PMC article. - A genome-wide in vitro bacterial-infection screen reveals human variation in the host response associated with inflammatory disease.
Ko DC, Shukla KP, Fong C, Wasnick M, Brittnacher MJ, Wurfel MM, Holden TD, O'Keefe GE, Van Yserloo B, Akey JM, Miller SI. Ko DC, et al. Am J Hum Genet. 2009 Aug;85(2):214-27. doi: 10.1016/j.ajhg.2009.07.012. Epub 2009 Aug 6. Am J Hum Genet. 2009. PMID: 19664744 Free PMC article.
References
- Amrine-Madsen H, Koepfli KP, Wayne RK, Springer MS. A new phylogenetic marker, apolipoprotein B, provides compelling evidence for eutherian relationships. Mol Phylogenet Evol. 2003;28:225–240. - PubMed
- Aparicio S, Chapman J, Stupka E, et al. (41 co-authors) Whole-genome shotgun assembly and analysis of the genome of Fugu rubripes. Science. 2002;297:1301–1310. - PubMed
- Arnason U, Janke A. Mitogenomic analyses of eutherian relationships. Cytogenet Genome Res. 2002;96:20–32. - PubMed
- Barroso CML, Schneider H, Schneider MPC, Sampaio I, Harada ML, Czelusniak J, Goodman M. Update on the phylogenetic systematics of new world monkeys: further DNA evidence for placing the pygmy marmoset (Cebuella) within the genus Callithrix. Int J Primatol. 1997;18:651–674.
Publication types
MeSH terms
LinkOut - more resources
Full Text Sources
Miscellaneous


