Inhibition of histone acetyltransferase by glycosaminoglycans - PubMed (original) (raw)
Inhibition of histone acetyltransferase by glycosaminoglycans
Jo Ann Buczek-Thomas et al. J Cell Biochem. 2008.
Abstract
Histone acetyltransferases (HATs) are a class of enzymes that participate in modulating chromatin structure and gene expression. Altered HAT activity has been implicated in a number of diseases, yet little is known about the regulation of HATs. In this study, we report that glycosaminoglycans (GAGs) are potent inhibitors of p300 and pCAF HAT activities in vitro, with heparin and heparan sulfate proteoglycans (HSPGs) being the most potent inhibitors. The mechanism of inhibition by heparin was investigated. The ability of heparin to inhibit HAT activity was in part dependent upon its size and structure, as small heparin-derived oligosaccharides (>8 sugars) and N-desulfated or O-desulfated heparin showed reduced inhibitory activity. Heparin was shown to bind to pCAF; and enzyme assays indicated that heparin shows the characteristics of a competitive-like inhibitor causing an approximately 50-fold increase in the apparent Km of pCAF for histone H4. HSPGs isolated from corneal and pulmonary fibroblasts inhibited HAT activity with similar effectiveness as heparin. As evidence that endogenous GAGs might be involved in modulating histone acetylation, the direct addition of heparin to pulmonary fibroblasts resulted in an approximately 50% reduction of histone H3 acetylation after 6 h of treatment. In addition, Chinese hamster ovary cells deficient in GAG synthesis showed increased levels of acetylated histone H3 compared to wild-type parent cells. GAGs represent a new class of HAT inhibitors that might participate in modulating cell function by regulating histone acetylation.
(c) 2008 Wiley-Liss, Inc.
Figures
FIGURE 1. Inhibition of pCAF and p300 histone acetyltransferase (HAT) activities by heparin
In the presence of [3H] acetyl CoA (0.5μCi; 50 μM), core histones (10μg; ~10 μM) was incubated with either pCAF (0.5μg; 0.52 μM) (filled circles) or p300 HAT domain (0.83μg; 0.17 μM) (open circles) and the indicated heparin concentrations for 30 minutes at 30°C. Formation of [3H] acetylated core histones was determined by vacuum filtration of the samples across a nitrocellulose membrane and quantitated by liquid scintillation counting. IC50 values were determined for heparin inhibition of pCAF (6.7 ±1.1 μg/ml) and p300 (4.3 ±0.7 μg/ml). The data are expressed as the mean % Control ±SD. Background CPM in samples without added enzyme was 5781.25 while [3H] acetylated histone CPM in samples without heparin were 16484.5 for pCAF containing samples and 9960.5 for the p300 HAT domain samples. Inhibition of p300 activity by heparin was observed in 8 separate experiments and the inhibition of pCAF by heparin was observed in 7 experiments. A dose dependent inhibition of HAT1 was observed in one experiment (data not shown).
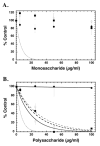
FIGURE 2. Specificity of inhibition of pCAF HAT activity by simple and complex saccharide moieties
Core histones (10 μg; ~10 μM) were incubated with pCAF (0.5μg; 0.52 μM), [3H] acetyl CoA (0.5μCi; 50 μM) and the indicated saccharide concentrations for 30 minutes at 30°C in a final volume of 50 μl. 35μL aliquots of the reaction mixtures were spotted onto a nitrocellulose filter in a dot blot apparatus to remove unincorporated [3H]acetyl CoA. The sample wells and filters were washed with 50mM tris pH 7.6 and the samples were processed for liquid scintillation counting. In Panel A, the samples were assayed in the presence of simple sugars including D-glucuronic acid (filled circles), N-acetyl-D-glucosamine (open circles) and D-glucosamine (filled squares) at the indicated concentrations. The dashed line represents the inhibition by heparin (from Figure 1) for comparison. In Panel B, the reaction mixtures contained the indicated polysaccharide concentrations of dextran (filled circles), chondroitin sulfate (open circles), keratan sulfate (filled squares) and hyaluronic acid (open squares). The dashed line represents the inhibition by heparin (from Figure 1) for comparison. IC50 values were determined for chondroitin sulfate (13.7 ±2.9 μg/ml), keratan sulfate (18.5 ±3.7 μg/ml), and hyaluronic acid (21.3 ±3.1). In both panels, the data are expressed as the mean % Control ±SD. The data presented are from multiple assays. Background corrected [3H] CPM in pCAF samples without saccharide ranged from 4942 to 8389 under independent assay conditions. The effects of each reagent were tested at least three times with pCAF and similar results were observed. All samples were also tested for inhibition of p300 HAT activity at least once (data not shown); no differences in the relative activities of these compounds were observed with p300 compared to pCAF.
FIGURE 3. Inhibition of pCAF HAT activity by chemically modified heparin molecules
Core histones (10 μg; ~10 μM) were incubated with pCAF (0.5μg; 0.52 μM), [3H] acetyl CoA (0.5μCi; 50 μM) and the indicated concentration of 2-O-Desulfated (filled circles), 6-O Desulfated (open circles), De-N-Sulfated (filled squares) and Fully De-O-Sulfated (open squares) heparin for 30 minutes at 30°C in 50 μl final volume. 35μL aliquots of the reaction mixtures were filtered through a nitrocellulose membrane under vacuum in a Bio Dot Apparatus. The wells and filter were washed with 50mM tris pH 7.6 and the membrane was processed for liquid scintillation counting. The dashed line represents the inhibition by heparin (from Figure 1) for comparison. IC50 values were determined for 2-O-Desulfated (9.8 ±2.4 μg/ml), 6-O Desulfated (8.7 ±1.2 μg/ml), De-N-Sulfated (20.5 ±3.9 μg/ml) and Fully De-O-Sulfated (15.7 ±2.1 μg/ml). The data are expressed as the mean % Control ±SD. Average blank corrected CPM in pCAF samples without heparin was 7105. Each modified heparin was analyzed for inhibition of HAT activity at least three times. In one study the effects of N-desulfated fully N-acetylated heparin was compared to N-desulfated heparin and no differences were observed (data not shown), indicating that the reduced activity of N-desulfated heparin is not reflective of the formation of primary amines.
FIGURE 4. Inhibition of pCAF HAT activity by different sized heparin molecules
Different sized oligosaccharides derived from heparin were present at 10μg/mL final concentrations in pCAF-mediated HAT activity assays. 35μL of the reaction mixtures were spotted onto a nitrocellulose membrane in a Bio Dot apparatus under vacuum to separate [3H]acetylated core histones from unincorporated [3H]acetyl CoA. Indicated are the actual saccharide size present in each heparin derivative (4-10) with Oligo I (14-18 sugars), Oligo II (12-14 sugars) and the starting material (heparin). The data are expressed as % Inhibition ±SD. CPM in pCAF containing samples without heparin was 7635 after blank correction. The effects of different sized oligosaccharides were analyzed three times with pCAF and twice with p300 with similar results observed including the relative reduction of activity with the Oligo II chain.
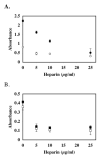
FIGURE 5. Heparin inhibits HAT activity toward histone H3 and histone H4 substrates
pCAF HAT Enzyme (0.5μg; 0.51 μM) and p300 HAT Domain (1.67μg; 0.33 μM) were assayed for HAT activity in the absence and presence of heparin using a commercially available HAT assay kit. In Panel A, heparin-mediated inhibition of pCAF HAT activity was assayed using histone H3 (open circles) and histone H4 (filled circles) peptide substrates. In Panel B, heparin-mediated p300 HAT activity was assayed using histone H3 (open squares) and histone H4 (filled squares) substrates. In both panels, the data are expressed as relative absorbance ± SD. The average background absorbance in the absence of enzyme was 0.151, which was subtracted from all absorbance values from enzyme containing samples. The activity of pCAF with H3 and H4 peptides was measured three times; the activity of p300 with the H3 and H4 peptides was measured twice.
FIGURE 6. Heparin binds to pCAF HAT enzyme
pCAF HAT enzyme was incubated with heparin-Sepharose or Sepharose resin in the presence of increasing sodium chloride concentrations for 1 hour at 4°C. Following centrifugation at 10,000_g_ for 10 minutes, the supernatants were assayed for enzymatic activity. Supernatant aliquots (20μl) were assayed for HAT activity in the presence of 10μg (~10 μM) core histones and [3H]acetyl CoA (0.5μCi; 50 μM) for 30 minutes at 30°C prior to vacuum filtration onto a nitrocellulose membrane. The sample wells and filter were washed with 50mM tris pH 7.6 and the membrane was processed for liquid scintillation counting. The data are expressed as percent relative pCAF HAT activity (pCAF HAT activity recovered after incubation with heparin-Sepharose/pCAF HAT activity recovered after incubation with Sepharose) × 100. The data presented are mean % Control ±SD. Similar results were observed in three separate experiments.
FIGURE 7. Double-reciprocal plot for heparin inhibition of pCAF catalyzed acetylation of histone H4 peptide
Various concentrations of histone H4 peptide (19 nM to 7.7 μM; calculated based on final reaction volume of 50 μl) in triplicate were linked to streptavidin coated 96-well plates and pCAF (2 μg/ml; 0.1 μM) was reacted with the H4 peptide in the presence (filled circles) or absence (open circles) of heparin (10 μg/ml; 0.69 μM) for 30 min at 30°C. All reactions contained 100 μM acetyl-CoA. Acetylated H4 was detected with anti-acetyl-lysine antibodies, and the absorbance reading represented the velocity (V) of the reaction. A double-reciprocal plot was generated by plotting 1/V versus 1/[H4]. Data were fit by linear regression for presentation in the plot. Velocity versus H4 concentration data were fit by non-linear least squares to determine apparent kinetic constants. Similar results were observed in two separate experiments. Similar results were observed with histone H3 peptides in one experiment (data not shown).
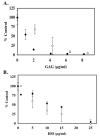
FIGURE 8. HSPG Fragments are potent inhibitors of HAT Activity
In panel A, HSPGf were generated from corneal stromal fibroblast cell cultures and purified as described in Materials and Methods. The ability of p300 HAT domain to acetylate biotinylated histone H4 substrate was assessed in the presence of native HSPGf (open circles) or HSPGf (filled circles) that were previously digested with 5mU/mL chondroitinase ABC. The reactions were incubated for 30 minutes at 30°C prior to capture with immobilized streptavidin. The data are expressed as % control from two separate experiments. The average blank corrected CPM of p300 samples treated without HSPGf or ABCase-treated HSPGf was 1303. In panel B, HSPGf were purified from pulmonary fibroblast elastase supernatants by anion exchange chromatography as described in Materials and Methods. Free GAG chains were generated by treating the HSPGf with alkaline borohydride and were recovered by anion exchange methods. The ability of native HSPGf (open circles) and HSf chains (filled circles) to inhibit pCAF HAT activity was measured. 10μg core histones (~10 μM) was incubated with pCAF (0.5μg; 0.51 μM), [3H] acetyl Co A (0.5μCi; 50 μM) and the indicated HSf concentration for 30 minutes at 30°C prior to spotting an aliquot of the reaction mixture onto a nitrocellulose filter and counting radioactivity. The data is expressed as the mean % Control ±SD. pCAF containing samples without heparin was 5492 cpm after blank correction. Inhibition of HAT activity by corneal fibroblast-derived HSPGf was observed in six separate experiments. Inhibition of HAT activity by pulmonary HSPGf was observed in three experiments and the effects of free HS chains were analyzed twice.
FIGURE 9. Nuclear localization of sulfated proteoglycans
Corneal fibroblasts were plated at 15,000 cells/cm2 on fibronectin coated plates in serum free medium [Hsia et al., 2003; Richardson et al., 2001] and allowed to incubate for 16h at 37°C. 35SO4 (100 μCi/mL) was added and the cells were incubated for the indicated time and then suspended with trypsin and cytoplasmic and nuclear fractions isolated and extracted as described in Materials and Methods. Samples were subjected to cationic nylon filtration and 35S-proteoglycan quantitated by scintillation counting. Data are presented as the ratio of nuclear to cytoplasmic levels (Nuc/Cyt) over time. The data represent the mean Nuc/Cyt values of 4 separate experiments each conducted in duplicate; error bars represent the standard error of the mean values from the independent experiments. Three independent pulse-chase analyses of 35S-proteoglycan in corneal fibroblasts were conducted, with similar results.
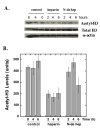
FIGURE 10. Heparin inhibition of histone H3 acetylation in pulmonary fibroblasts
Pulmonary fibroblasts were treated with heparin (50 μg/ml) or N-desulfated-heparin (50 μg/ml) or nothing (control) for 2, 4 or 6 hours. Cells extracts were subjected to immunoblot analysis for total histone H3, acetylated histone H3 and alpha actin. Panel A shows representative immunoblots of acetylated histone H3 (top row), total histone H3 (middle row), and alpha actin (bottom row). Panel B is a bar graph representation of the average relative density measurements of the acetyl-H3 bands from four separate samples ±SD at each time point (N-de hep = N-desulfated heparin). ANOVA followed by the Newman-Kleus multi-comparison t-test revealed significant differences between the heparin treated and control samples at all time points, significant differences between heparin and N-desulfated heparin at the 2 h and 4 h time points, and significant differences between the N-desulfated heparin treated and control samples at the 6 h time point. There were no significant differences observed between the control groups at the three time points. Similar results were observed in three separate experiments with cells from different primary isolations.
FIGURE 11. Determination of acetylated histone H3 levels in wild-type CHO-K1 and proteoglycan-deficient CHO-745 Cells
CHO-K1 and CHO 745 cells were seeded at 5,000 cells per well into 96 well plates in medium containing 10% FBS. The medium was changed after 24 h and the cells were then maintained for 48 h prior to fixation. The cells were blocked overnight and incubated with an antibody solution containing either 4μg/ml anti-acetylated histone H3 or anti-histone H3. The cells were washed and treated with 0.5μg/ml HRP-linked anti rabbit IgG prior to TMB substrate development. In Panel A, the average relative absorbance values ± SEM for acetylated histone H3 (filled bars) and unmodified histone H3 (open bars) are presented. In Panel B, the relative acetylation ratios (acetylated H3 absorbance/unmodified H3 absorbance) ±SD are presented for both cell types. The data presented are from one of three independent experiments. Student’s t-test revealed significant differences between the acetylation ratios of the two cell lines.
Similar articles
- Isothiazolones as inhibitors of PCAF and p300 histone acetyltransferase activity.
Stimson L, Rowlands MG, Newbatt YM, Smith NF, Raynaud FI, Rogers P, Bavetsias V, Gorsuch S, Jarman M, Bannister A, Kouzarides T, McDonald E, Workman P, Aherne GW. Stimson L, et al. Mol Cancer Ther. 2005 Oct;4(10):1521-32. doi: 10.1158/1535-7163.MCT-05-0135. Mol Cancer Ther. 2005. PMID: 16227401 - The scaffolding protein JADE1 physically links the acetyltransferase subunit HBO1 with its histone H3-H4 substrate.
Han J, Lachance C, Ricketts MD, McCullough CE, Gerace M, Black BE, Côté J, Marmorstein R. Han J, et al. J Biol Chem. 2018 Mar 23;293(12):4498-4509. doi: 10.1074/jbc.RA117.000677. Epub 2018 Jan 30. J Biol Chem. 2018. PMID: 29382722 Free PMC article. - MRG15 activates the cdc2 promoter via histone acetylation in human cells.
Peña AN, Tominaga K, Pereira-Smith OM. Peña AN, et al. Exp Cell Res. 2011 Jul 1;317(11):1534-40. doi: 10.1016/j.yexcr.2011.02.001. Epub 2011 Feb 14. Exp Cell Res. 2011. PMID: 21324423 Free PMC article. - Histone acetyltransferases: challenges in targeting bi-substrate enzymes.
Wapenaar H, Dekker FJ. Wapenaar H, et al. Clin Epigenetics. 2016 May 26;8:59. doi: 10.1186/s13148-016-0225-2. eCollection 2016. Clin Epigenetics. 2016. PMID: 27231488 Free PMC article. Review. - Histone acetyl transferases as emerging drug targets.
Dekker FJ, Haisma HJ. Dekker FJ, et al. Drug Discov Today. 2009 Oct;14(19-20):942-8. doi: 10.1016/j.drudis.2009.06.008. Epub 2009 Jul 2. Drug Discov Today. 2009. PMID: 19577000 Review.
Cited by
- Heparan sulfate: a ubiquitous glycosaminoglycan with multiple roles in immunity.
Simon Davis DA, Parish CR. Simon Davis DA, et al. Front Immunol. 2013 Dec 18;4:470. doi: 10.3389/fimmu.2013.00470. Front Immunol. 2013. PMID: 24391644 Free PMC article. - Upregulation of ERK-EGR1-heparanase axis by HDAC inhibitors provides targets for rational therapeutic intervention in synovial sarcoma.
Lanzi C, Favini E, Dal Bo L, Tortoreto M, Arrighetti N, Zaffaroni N, Cassinelli G. Lanzi C, et al. J Exp Clin Cancer Res. 2021 Dec 2;40(1):381. doi: 10.1186/s13046-021-02150-y. J Exp Clin Cancer Res. 2021. PMID: 34857011 Free PMC article. - Heparan sulfate-protein binding specificity.
Nugent MA, Zaia J, Spencer JL. Nugent MA, et al. Biochemistry (Mosc). 2013 Jul;78(7):726-35. doi: 10.1134/S0006297913070055. Biochemistry (Mosc). 2013. PMID: 24010836 Free PMC article. Review. - Significance of heparanase in cancer and inflammation.
Vlodavsky I, Beckhove P, Lerner I, Pisano C, Meirovitz A, Ilan N, Elkin M. Vlodavsky I, et al. Cancer Microenviron. 2012 Aug;5(2):115-32. doi: 10.1007/s12307-011-0082-7. Epub 2011 Aug 3. Cancer Microenviron. 2012. PMID: 21811836 Free PMC article. - Prognostic value of heparanase expression and cellular localization in oral cancer.
Leiser Y, Abu-El-Naaj I, Sabo E, Akrish S, Ilan N, Ben-Izhak O, Peled M, Vlodavsky I. Leiser Y, et al. Head Neck. 2011 Jun;33(6):871-7. doi: 10.1002/hed.21545. Epub 2010 Sep 21. Head Neck. 2011. PMID: 20859999 Free PMC article.
References
- Ait-Si-Ali S, Ramirez S, Barre FX, Dkhissi F, Magnaghi-Jaulin L, Girault JA, Robin P, Knibiehler M, Pritchard LL, Ducommun B, Trouche D, Harel-Bellan A. Histone acetyltransferase activity of CBP is controlled by cycle-dependent kinases and oncoprotein E1A. Nature. 1998;396:184–6. - PubMed
- Ambrosio AL, Iglesias MM, Wolfenstein-Todel C. The heparin-binding lectin from ovine placenta: purification and identification as histone H4. Glycoconj J. 1997;14:831–6. - PubMed
- Balasubramanyam K, Swaminathan V, Ranganathan A, Kundu TK. Small molecule modulators of histone acetyltransferase p300. J Biol Chem. 2003;278:19134–40. - PubMed
- Barnes PJ, Adcock IM, Ito K. Histone acetylation and deacetylation: importance in inflammatory lung diseases. Eur Respir J. 2005;25:552–63. - PubMed
- Bassols A, Massagué J. Transforming growth factor ß regulates the expression and structure of extracellular matrix chondroitin/dermatan sulfate proteoglycans. J Biol Chem. 1988;263:3039–3045. - PubMed
Publication types
MeSH terms
Substances
LinkOut - more resources
Full Text Sources
Research Materials
Miscellaneous


