A small stem loop element directs internal initiation of the URE2 internal ribosome entry site in Saccharomyces cerevisiae - PubMed (original) (raw)
A small stem loop element directs internal initiation of the URE2 internal ribosome entry site in Saccharomyces cerevisiae
Lucas C Reineke et al. J Biol Chem. 2008.
Abstract
Internal initiation of translation is the process of beginning protein synthesis independent of the m(7)G cap structure at the 5'-end of an mRNA molecule. We have previously shown that the URE2 mRNA in the yeast Saccharomyces cerevisiae contains an internal ribosome entry site (IRES) whose activity is suppressed by eukaryotic initiation factor 2A (eIF2A; YGR054W). In this study, the minimal sequence required to efficiently direct internal initiation was determined using a system that abrogates cap-dependent scanning of the 40 S ribosomal subunit in both wild-type and eIF2A knock-out cells. Subsequently, secondary structural elements within the minimal sequence were determined by probing with RNases T1 and V1 and the small molecule diethylpyrocarbonate. It was found that the URE2 minimal IRES comprises a 104 nucleotide A-rich stem loop element encompassing the internal AUG codon. Interestingly, the internal AUG seems to be involved in base-pairing interactions that would theoretically hamper its ability to interact with incoming initiator tRNA molecules. Furthermore, none of the truncations used to identify the minimal IRES element were capable of abrogating the suppressive effect of eIF2A. Our data provide the first insight into the RNA structural requirements of the yeast translational machinery for cap-independent initiation of protein synthesis.
Figures
FIGURE 1.
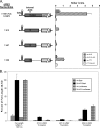
URE2 truncations indicate enhancer and inhibitory sequences downstream of the internal AUG codon. A, β-galactosidase assays using the p281-4 reporter construct, which harbors a stable stem loop designed to inhibit cap-dependent scanning of the 40 S ribosomal subunit, were used to determine the importance of the deleted URE2 regions. Left, nucleotide numbers and schematic representations of the different_URE2_ mRNA truncations. Right, activity measurements of the respective URE2 mRNA truncations in both BY4741 (wild-type; gray bars) and BY4684 (ΔeIF2A; hatched bars) yeast cells. Activity measurements for each truncation containing a CTT mutation in place of the internal AUG are shown for wild-type (black bars) and ΔeIF2A cells (dotted bars). B, a new p281-4 construct (designated p281-4-Firefly) in which the LACZ gene from p281-4 was replaced by the firefly luciferase gene was created by homologous recombination. Luciferase activity was then measured for each 3′ truncation in wild-type and ΔeIF2A cells. β-Galactosidase (wild-type; gray bars and ΔeIF2A; black bars) and luciferase (wild-type; striped bars; ΔeIF2A, grid pattern) activity are plotted as percent of full-length URE2 measured in ΔeIF2A cells.
FIGURE 2.
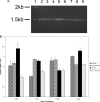
Abundance of mRNA is not responsible for the different levels of β-galactosidase activity observed in functional assays of 3′truncations. RT-PCR analysis of levels of reporter mRNAs was conducted in both wild-type and ΔeIF2A knock-out cells using primers directed against the LACZ region of the mRNA. A, 1% agarose gel showing the results of RT-PCR analysis of AUG constructs in each cell type. The molecular weight standard (lane 1), full-length URE2 (lanes 2 and 3), URE2 nucleotides 7-812 (lanes 4 and 5), URE2 nucleotides 7-497 (lanes 6 and_7_), and URE2 nucleotides 7-309 (lanes 8 and_9_) are shown. Lanes 2, 4, 6, and 8 represent levels of mRNAs in wild-type cells, whereas lanes 3, 5, 7, and 9 represent levels of mRNA in eIF2A knock-out cells. B, bar graph showing levels of reporter mRNA relative to PGK1 mRNA for each truncation (with AUG and CTT at the position of the internal codon) in both cell types. Gray bars represent AUG-containing truncations in wild-type cells, hatched bars represent AUG-containing constructs in ΔeIF2A cells, black bars represent CTT-containing constructs in wild-type cells, and dotted bars represent relative mRNA levels of CTT-containing constructs in ΔeIF2A cells.
FIGURE 3.
URE2 truncations indicate an inhibitory sequence upstream of the internal AUG codon. The p281-4 reporter, described above, was used to determine the importance of 5′ URE2 deletions. Left, nucleotide numbers and schematic representations of different URE2 truncations. Right, activity measurements of the respective_URE2_ truncations in both BY4741 (wild-type; gray bars) and BY4684 (ΔeIF2A; hatched bars) yeast cells. Activity measurements for each truncation containing a CTT mutation in place of the internal AUG are shown for wild-type (black bars) and ΔeIF2A cells (dotted bars).
FIGURE 4.
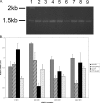
Abundance of mRNA is not responsible for the different levels of β-galactosidase activity observed in functional assays of 5′truncations. RT-PCR analysis of levels of reporter mRNAs was conducted as described under “Experimental Procedures.” A, 1% agarose gel showing the results of RT-PCR analysis of AUG constructs in each cell type. The molecular weight standard (lane 1), full-length_URE2_ (lanes 2 and 3), URE2 nucleotides 98-1061 (lanes 4 and 5), URE2 nucleotides 205-1061 (lanes 6 and 7), and URE2 nucleotides 246-1061 (lanes 8 and 9) are shown. Lanes 2, 4, 6, and_8_ represent levels of mRNAs in wild-type cells, whereas lanes 3, 5, 7, and 9 represent levels of mRNA in eIF2A knock-out cells.B, bar graph showing levels of reporter mRNA relative to_PGK1_ mRNA for each truncation (with AUG and CTT at the position of the internal codon) in both cell types. Gray bars represent AUG-containing truncations in wild-type cells, thatched bars represent AUG-containing constructs in ΔeIF2A cells, black bars represent CTT-containing constructs in wild-type cells, and dotted bars represent relative mRNA levels of CTT-containing constructs in ΔeIF2A cells.
FIGURE 5.
The URE2 minimal IRES element is located between nucleotides 205 and 309, and the upstream inhibitory element can be defined to a 25-nucleotide region upstream of the minimal IRES. The p281-4 reporter, described above, was used to determine the importance of 5′URE2 deletions. Left, nucleotide numbers and schematic representations of different URE2 truncations. Right, activity measurements of the respective URE2 truncations in both BY4741 (wild-type; gray bars) and BY4684 (ΔeIF2A; hatched bars) yeast cells. Activity measurements for each truncation containing a CTT mutation in place of the internal AUG are shown for wild-type (black bars) and ΔeIF2A cells (dotted bars).
FIGURE 6.
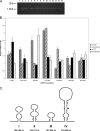
Abundance of mRNA is not responsible for levels of β-galactosidase observed in functional assays of combined truncations. RT-PCR analysis of levels of reporter mRNAs was conducted as described under “Experimental Procedures.” A, 1% agarose gel showing the results of RT-PCR analysis of AUG constructs in each cell type. The molecular weight standard (lane 1), full-length_URE2_ (lanes 2 and 3), URE2 nucleotides 205-1061 (lanes 4 and 5), URE2 nucleotides 98-309 (lanes 6 and 7), URE2 nucleotides 118-309 (lanes 8 and 9), URE2 nucleotides 140-309 (lanes 10 and 11), URE2 nucleotides 180-309 (lanes 12 and 13), and URE2 nucleotides 205-309 (lanes 14 and 15) are shown. Lanes 2, 4, 6, 8, 10, 12, and 14 represent levels of mRNAs in wild-type cells, whereas_lanes 3, 5, 7, 9, 11, 13_, and 15 represent levels of mRNA in eIF2A knock-out cells. B, bar graph showing levels of reporter mRNA relative to PGK1 for each truncation (with AUG and CTT at the position of the internal codon) in both cell types. Gray bars represent AUG-containing truncations in wild-type cells, thatched bars represent AUG-containing constructs in ΔeIF2A cells, black bars represent CTT-containing constructs in wild-type cells, and_dotted bars_ represent relative mRNA levels of CTT-containing constructs in ΔeIF2A cells. C, schematic representation of the inhibited IRES secondary structure as depicted by the MFOLD server. Each_Roman numeral_ corresponds to the stem loop depicted directly above it.
FIGURE 7.
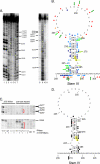
The minimal IRES element contains a stem loop structure that directs internal initiation. A, 6% acrylamide/7
m
urea gel analysis of RNase T1 (lanes 1 and 2), RNase V1 (lane 3), and DEPC-mediated strand scission analysis (lane 10). No RNase (lanes 4 and 5) and no DEPC reactions (lane 11) are shown. Lanes 2, 3, 5, 10, and 11 contain reactions conducted in the presence of 2.5 m
m
MgCl2. Additionally, base hydrolysis (lanes 6 and 9) and RNase T1 ladders (lanes 7 and 8) are shown. B, a composite structure that highlights the location of cleavages resulting from different probes is shown. Green arrows signify locations of RNase T1 cleavages, blue dots signify locations of RNase V1 cleavages, and_red triangles_ show locations of DEPC-mediated cleavages. Lower efficiency cleavages are denoted by light-colored shapes. Outlined shapes show locations of Mg2+-dependent changes in cleavage efficiency. The internal AUG codon is transposed on a yellow background. C, parallel comparison of minimal IRES RNase probing and an A238G point mutant within the minimal IRES (stem IV). Arrows illustrate that RNase T1 cleavage efficiency at nucleotides 267, 268, 276, and 277 are higher in the wild-type minimal IRES sequence, whereas red brackets illustrate increased RNase V1 cleavages at nucleotides 237-243 in the A238G mutant of the minimal IRES. D, a composite structure that highlights the differences in cleavage efficiency for RNases T1 (arrows) and RNase V1 (dots) between the wild-type and A238G mutant form of the_URE2_ minimal IRES. Black shapes illustrate increased cleavage in the mutant as compared with the wild-type, while gray shapes illustrate decreased cleavages in the mutant as compared with the wild-type. There were no obvious differences between the wild-type and mutant with DEPC probing. The internal AUG is highlighted in yellow, and the mutated nucleotide is denoted in red.
FIGURE 8.
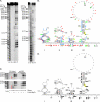
The inhibited IRES element does not significantly differ in secondary structure in the region of the minimal IRES element. A, 6% acrylamide/7
m
urea gel analysis of base hydrolysis (lanes 2 and 9) and RNase T1 ladders (lanes 1 and 8) are shown. RNase T1 (lanes 6 and 7), RNase V1 (lane 5), and DEPC-mediated strand scission analysis (lane 10). No RNase (lanes 3 and 4) and no DEPC reactions (lane 11) are shown. Lanes 3, 5, 6, 10, and 11 contain reactions conducted in the presence of 2.5 m
m
MgCl2.B, a composite structure that highlights the location of cleavages resulting from different probes is shown. Color and shape identities corresponding to intensity and probes are as depicted in Fig. 7_B_. The internal AUG codon is highlighted in yellow. C, parallel comparison of inhibited IRES RNase probing and the A148U/A202C/A238G triple mutant.Arrows illustrate increased RNase T1 cleavage efficiency in the wild type as compared with the mutant, which occur at nucleotides 153 and 156 and at nucleotide 255 in stem IV that corresponds to the minimal IRES region.Red brackets illustrate increased RNase V1 cleavages at nucleotides 147-151 in the triple mutant of the inhibited IRES. D, a composite structure that highlights the differences in cleavage efficiency for between the wild-type and A148U/A202C/A238G triple mutant form of the_URE2_-inhibited IRES. Shapes coincide with the labeling depicted in Fig. 7_D_, except that triangles are added to denote changes in DEPC modification in the mutant as compared with the wild type. Shape colors are as depicted in Fig. 7_D_ where black indicates increased cleavage efficiency and gray indicates decreased cleavage efficiency in the mutant relative to the wild type. The internal AUG is highlighted in_yellow_, and mutated nucleotides are shown in red letters.
FIGURE 9.
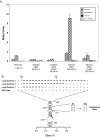
Effects of apical loop deletions and reductions in stem stability on internal initiation on the URE2 IRES. A, the monocistronic β-galactosidase reporter plasmid, p281-4 described above, was used to assess the effect of the A238G mutation on the inhibited IRES element and the minimal IRES (stem IV). Bar patterns and_shades_ correspond to the yeast strains and constructs described in Figs. 1, 2, 3, 4, 5 and 6. B, schematic representation of three loop deletions and three mutations (U271/272/274C) within the double-stranded region of stem IV. Dashed lines represent nucleotides that were deleted relative to wild-type within the loop region. The expected changes in base pairing potential upon introduction of three point mutations in the helix are shown to the right of the structure. The internal AUG codon is highlighted in gray. C, activity measurements for the apical loop deletion and mutations in stem IV shown in_B_ using the p281-4 reporter construct. Bar patterns and_shades_ correspond to yeast strains and constructs described above.
Similar articles
- Characterization of the functional role of nucleotides within the URE2 IRES element and the requirements for eIF2A-mediated repression.
Reineke LC, Merrick WC. Reineke LC, et al. RNA. 2009 Dec;15(12):2264-77. doi: 10.1261/rna.1722809. Epub 2009 Oct 27. RNA. 2009. PMID: 19861427 Free PMC article. - Novel characteristics of the biological properties of the yeast Saccharomyces cerevisiae eukaryotic initiation factor 2A.
Komar AA, Gross SR, Barth-Baus D, Strachan R, Hensold JO, Goss Kinzy T, Merrick WC. Komar AA, et al. J Biol Chem. 2005 Apr 22;280(16):15601-11. doi: 10.1074/jbc.M413728200. Epub 2005 Feb 16. J Biol Chem. 2005. PMID: 15718232 - eIF1 Loop 2 interactions with Met-tRNAi control the accuracy of start codon selection by the scanning preinitiation complex.
Thakur A, Hinnebusch AG. Thakur A, et al. Proc Natl Acad Sci U S A. 2018 May 1;115(18):E4159-E4168. doi: 10.1073/pnas.1800938115. Epub 2018 Apr 16. Proc Natl Acad Sci U S A. 2018. PMID: 29666249 Free PMC article. - Hepatitis C Virus Translation Regulation.
Niepmann M, Gerresheim GK. Niepmann M, et al. Int J Mol Sci. 2020 Mar 27;21(7):2328. doi: 10.3390/ijms21072328. Int J Mol Sci. 2020. PMID: 32230899 Free PMC article. Review. - Protein-based inheritance in Saccharomyces cerevisiae: [URE3] as a prion form of the nitrogen regulatory protein Ure2.
Edskes HK. Edskes HK. Res Microbiol. 2001 Sep;152(7):605-12. doi: 10.1016/s0923-2508(01)01239-6. Res Microbiol. 2001. PMID: 11605980 Review.
Cited by
- Secondary RNA structure and nucleotide specificity contribute to internal initiation mediated by the human tau 5' leader.
Veo BL, Krushel LA. Veo BL, et al. RNA Biol. 2012 Nov;9(11):1344-60. doi: 10.4161/rna.22181. Epub 2012 Sep 20. RNA Biol. 2012. PMID: 22995835 Free PMC article. - The Sua5 protein is essential for normal translational regulation in yeast.
Lin CA, Ellis SR, True HL. Lin CA, et al. Mol Cell Biol. 2010 Jan;30(1):354-63. doi: 10.1128/MCB.00754-09. Mol Cell Biol. 2010. PMID: 19884342 Free PMC article. - Alternative ways to think about cellular internal ribosome entry.
Gilbert WV. Gilbert WV. J Biol Chem. 2010 Sep 17;285(38):29033-8. doi: 10.1074/jbc.R110.150532. Epub 2010 Jun 24. J Biol Chem. 2010. PMID: 20576611 Free PMC article. Review. - Genome-wide measurement of RNA secondary structure in yeast.
Kertesz M, Wan Y, Mazor E, Rinn JL, Nutter RC, Chang HY, Segal E. Kertesz M, et al. Nature. 2010 Sep 2;467(7311):103-7. doi: 10.1038/nature09322. Nature. 2010. PMID: 20811459 Free PMC article.
References
- Merrick, W. C. (2004) Gene (Amst.) 332 1-11 - PubMed
- Komar, A. A., and Hatzoglou, M. (2005) J. Biol. Chem. 280 23425-23428 - PubMed
Publication types
MeSH terms
Substances
LinkOut - more resources
Full Text Sources
Other Literature Sources
Molecular Biology Databases
Research Materials
Miscellaneous
