Genome landscapes and bacteriophage codon usage - PubMed (original) (raw)
Genome landscapes and bacteriophage codon usage
Julius B Lucks et al. PLoS Comput Biol. 2008.
Abstract
Across all kingdoms of biological life, protein-coding genes exhibit unequal usage of synonymous codons. Although alternative theories abound, translational selection has been accepted as an important mechanism that shapes the patterns of codon usage in prokaryotes and simple eukaryotes. Here we analyze patterns of codon usage across 74 diverse bacteriophages that infect E. coli, P. aeruginosa, and L. lactis as their primary host. We use the concept of a "genome landscape," which helps reveal non-trivial, long-range patterns in codon usage across a genome. We develop a series of randomization tests that allow us to interrogate the significance of one aspect of codon usage, such as GC content, while controlling for another aspect, such as adaptation to host-preferred codons. We find that 33 phage genomes exhibit highly non-random patterns in their GC3-content, use of host-preferred codons, or both. We show that the head and tail proteins of these phages exhibit significant bias towards host-preferred codons, relative to the non-structural phage proteins. Our results support the hypothesis of translational selection on viral genes for host-preferred codons, over a broad range of bacteriophages.
Conflict of interest statement
The authors have declared that no competing interests exist.
Figures
Figure 1. GC3 and CAI landscapes for lambda phage.
Landscapes of GC3. (left) and CAI (right) measures of codon usage in Lambda phage. Only coding sequences are considered, which when concatenated together are 40,773 bp long (see Table 2). The GC3 landscape is the mean-centered cumulative sum of the GC3 content (GC3 = 1, AT3 = 0) of codons. The CAI landscape is the mean-centered cumulative sum of the log _w_-value for each codon. For each landscape, a region exhibiting an uphill slope corresponds to higher than average GC3 or CAI. The horizontal purple band represents the expected amount of variation in a random walk of GC3 or AT3 choices, given by Equation 2. Both landscapes exhibit features far outside of the purple bands, indicating that the patterns of codon usage are highly non-random. Gene boundaries are represented by the bars in the histograms below each landscape. The height of the bars in the histogram indicate the GC3 and CAI values for each gene.
Figure 2. Snapshots of simulated synonymous mutation in the lambda phage genome.
(A) Shows GC3 and (B) shows CAI landscapes. In between successive snapshots (labeled by integers), N synonymous mutations are introduced into the genome and the resulting landscape is shown, where N is the number of codons in the lambda phage genome (see the Genome Landscapes section). These snapshots show that the simulated genome landscapes approach the random null model, indicated by the purple band (see Figure 1). The final CAI landscape (3) lies almost completely within the purple band. Using the lambda phage mutation rate of 7.7×10⁻⁸ mutations/bp/replication , we can estimate that approximately 107 genome replications would be required to relax within the purple bars.
Figure 3. Observed and randomized landscapes for lambda phage.
The figure shows the observed GC3 (left) and CAI (right) landscapes, plotted in black, along with the mean±1, and ±2 standard deviations of randomized trials, shown in aqua (bold line, dark and light regions, respectively). The aqua randomization test shown here draws random synonymous codons that preserve the exact amino acid sequence, according to probabilities that preserve the global codon usage distribution of the lambda genome. For the most part, the observed landscapes lie significantly outside the distribution of randomized landscapes–implying that the amino acid content of genes is not responsible for the observed pattern of the CAI landscape. In the lower panel, however, genes whose GC3 (left) or CAI (right) values fall between the 0.025 and 0.975 quantile of the random trials are shadowed in grey; the GC3/CAI values of such genes are not significantly different from random, given their amino acid sequence.
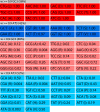
Figure 4. E. coli codon usage master table.
The table of 61 codons along with their associated _w_-values is shown for E. coli. The _w_-value of each codon reflects its frequency in highly transcribed E. coli genes (see main text). The Table 1 is divided into four regions: codons with high CAI (w≥0.9) ending in G or C (dark red); codons with high CAI ending in A or T (dark blue); codons with low CAI (w<0.9) ending in G or C (light red); codons with low CAI ending in A or T (light blue). As the table shows, there is a slight bias for GC3 in the high-CAI codons (58%), and slight bias away from GC3 in the low-CAI codons (48%).
Figure 5. Observed and randomized landscapes for lambda phage.
Observed landscapes are shown along with randomized landscapes associated with the green and orange tests. The green randomization procedure tests the significance of the GC3 landscape controlling for the observed CAI (actually, BCAI) variation across the genome. The orange randomization procedure tests the significance of the BCAI landscape, controlling for the observed GC3 variation across the genome. Both tests preserve the amino-acid sequence exactly. Both observed landscapes lie outside the distribution of random trials, indicating there is non-random GC3 content controlling for CAI, and non-random CAI content controlling for GC3.
Figure 6. Schematics of preferred codon usage tables for E. coli, P. aeruginosa, and L. lactis following the conventions of Figure 4.
Unlike E. coli, P. aeruginosa strongly favors GC3 in high-CAI codons (94%), and L. lactis strongly favors AT3 in high-CAI codons (72%).
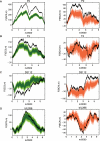
Figure 7. Green (left) and orange (right) randomization tests for several phages.
Bacteriophages P2 (A) and T3 (B) both infect E. coli. Phage D3112 (C) infects P. aeruginosa. Phage bIL286 (D) infects L. lactis. T3 is the only non-temperate phage of this group. See Table 2 for combined Fisher p-values for these tests. In the case of bIL286, note the lack of evidence for codon bias evident in the green and orange tests for bIL286, as confirmed by the insignificant _p_-values in Table 2. In this case, we cannot rule out the possibility that the observed pattern in GC3 is determined completely by the amino acid and CAI sequence (green), or that the observed pattern in CAI is determined by the amino acid and GC3 sequence (orange).
Figure 8. Combined Fisher p-values for the green and orange randomization tests across 50 phage genomes.
Phage names are listed on the x-axis, and are sorted by their orange _p_-value. A total of 29 genomes exhibit non-random GC3 content controlling for CAI (green test); and a total of 22 genome exhibit non-random CAI content controlling for GC3 (orange test). 17 genomes pass both of these tests. The dashed horizontal line indicates the threshold for significance after Bonfernni correction (i.e. 5%/50). Upwards arrows indicate p-values that lie beyond the limits of the y-axis. See Table 2 for phage properties, including the _p_-values for these tests. Twenty four phage genomes that failed the aqua GC3 or CAI control tests are not included in this figure.
Figure 9. The relationship between codon usage and protein function in lambda phage.
The figure shows the aqua (CAI, as in Figure 3) and orange (BCAI, as in Figure 5) randomization tests overlaid with information about protein function: genes classified as structural are shown with a white background and all other genes with a grey background. The histograms indicate a clear relationship between the structural classification of a gene and its significance under the aqua and orange tests: structural genes typically have elevated quantiles in the aqua test, whereas other genes typically have depressed quantiles. In other words, structural genes exhibit elevated CAI values when controlling for their amino acid sequence, compared to codon usage in the genome as a whole. Moreover, as the orange histograms indicate, this pattern is not caused by variation in GC3 content: the structural genes exhibit elevated BCAI values after controlling for both their amino acid sequence and their GC3 sequence.
Similar articles
- Genome dynamics, codon usage patterns and influencing factors in Aeromonas hydrophila phages.
Tyagi A, Nagar V. Tyagi A, et al. Virus Res. 2022 Oct 15;320:198900. doi: 10.1016/j.virusres.2022.198900. Epub 2022 Aug 24. Virus Res. 2022. PMID: 36029927 - Significant differences in terms of codon usage bias between bacteriophage early and late genes: a comparative genomics analysis.
Mioduser O, Goz E, Tuller T. Mioduser O, et al. BMC Genomics. 2017 Nov 13;18(1):866. doi: 10.1186/s12864-017-4248-7. BMC Genomics. 2017. PMID: 29132309 Free PMC article. - Differential codon adaptation between dsDNA and ssDNA phages in Escherichia coli.
Chithambaram S, Prabhakaran R, Xia X. Chithambaram S, et al. Mol Biol Evol. 2014 Jun;31(6):1606-17. doi: 10.1093/molbev/msu087. Epub 2014 Feb 27. Mol Biol Evol. 2014. PMID: 24586046 Free PMC article. - Codon usage bias: causative factors, quantification methods and genome-wide patterns: with emphasis on insect genomes.
Behura SK, Severson DW. Behura SK, et al. Biol Rev Camb Philos Soc. 2013 Feb;88(1):49-61. doi: 10.1111/j.1469-185X.2012.00242.x. Epub 2012 Aug 14. Biol Rev Camb Philos Soc. 2013. PMID: 22889422 Review. - Diversity among the tailed-bacteriophages that infect the Enterobacteriaceae.
Casjens SR. Casjens SR. Res Microbiol. 2008 Jun;159(5):340-8. doi: 10.1016/j.resmic.2008.04.005. Epub 2008 Apr 30. Res Microbiol. 2008. PMID: 18550341 Free PMC article. Review.
Cited by
- Emerging translation strategies during virus-host interaction.
Hoang HD, Neault S, Pelin A, Alain T. Hoang HD, et al. Wiley Interdiscip Rev RNA. 2021 Jan;12(1):e1619. doi: 10.1002/wrna.1619. Epub 2020 Aug 5. Wiley Interdiscip Rev RNA. 2021. PMID: 32757266 Free PMC article. Review. - Phylodynamics of the emergence of influenza viruses after cross-species transmission.
Rahnama L, Aris-Brosou S. Rahnama L, et al. PLoS One. 2013 Dec 16;8(12):e82486. doi: 10.1371/journal.pone.0082486. eCollection 2013. PLoS One. 2013. PMID: 24358190 Free PMC article. - Isolation, Characterization, and Genome Sequence Analysis of a Novel Lytic Phage, Xoo-sp15 Infecting Xanthomonas oryzae pv. oryzae.
Nazir A, Dong Z, Liu J, Tahir RA, Ashraf N, Qing H, Peng D, Tong Y. Nazir A, et al. Curr Microbiol. 2021 Aug;78(8):3192-3200. doi: 10.1007/s00284-021-02556-z. Epub 2021 Jul 2. Curr Microbiol. 2021. PMID: 34213617 - Decoding mechanisms by which silent codon changes influence protein biogenesis and function.
Bali V, Bebok Z. Bali V, et al. Int J Biochem Cell Biol. 2015 Jul;64:58-74. doi: 10.1016/j.biocel.2015.03.011. Epub 2015 Mar 26. Int J Biochem Cell Biol. 2015. PMID: 25817479 Free PMC article. Review. - Genome organization and characterization of the virulent lactococcal phage 1358 and its similarities to Listeria phages.
Dupuis ME, Moineau S. Dupuis ME, et al. Appl Environ Microbiol. 2010 Mar;76(5):1623-32. doi: 10.1128/AEM.02173-09. Epub 2010 Jan 8. Appl Environ Microbiol. 2010. PMID: 20061452 Free PMC article.
References
- Bernardi G. The human genome: Organization and evolutionary history. Annu Rev Genet. 1995;29:445–476. - PubMed
- Francino M, Ochman H. Isochores result from mutation not selection. Nature. 1999;400(6739):30–31. - PubMed
- Galtier N. Gene conversion drives gc content evolution in mammalian histones. Trends Genet. 2003;19:65–68. - PubMed
- Eyre-Walker A. An analysis of codon usage in mammals: selection or mutation bias? J Mol Evol. 1991;33:442–449. - PubMed
- Lawrence JG, Hartl DL. Unusual codon bias occurring within insertion sequences in Escherichia coli. Genetica. 1991;84:23–29. - PubMed
Publication types
MeSH terms
LinkOut - more resources
Full Text Sources
Miscellaneous


