Bayesian hierarchical model for estimating gene expression intensity using multiple scanned microarrays - PubMed (original) (raw)
Bayesian hierarchical model for estimating gene expression intensity using multiple scanned microarrays
Rashi Gupta et al. EURASIP J Bioinform Syst Biol. 2008.
Abstract
We propose a method for improving the quality of signal from DNA microarrays by using several scans at varying scanner sensitivities. A Bayesian latent intensity model is introduced for the analysis of such data. The method improves the accuracy at which expressions can be measured in all ranges and extends the dynamic range of measured gene expression at the high end. Our method is generic and can be applied to data from any organism, for imaging with any scanner that allows varying the laser power, and for extraction with any image analysis software. Results from a self-self hybridization data set illustrate an improved precision in the estimation of the expression of genes compared to what can be achieved by applying standard methods and using only a single scan.
Figures
Figure 1
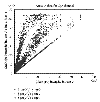
Plot of multiple scans of array  for data from Cy5 channel. The mean spot intensities from scan-3, scan-2, and scan-1 are plotted against scan-3. Saturation at the upper end of the intensities can be seen clearly. Very similar behavior was seen for the data from Cy3 channel.
Figure 2
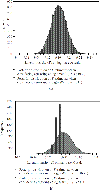
Posterior distribution of the latent variable  for two genes obtained when considering censoring at
  (i.e., at 10.71 and shown in grey) and when considering censoring at
  (i.e., at 11 and shown in black bars). The measurements from "scan-1, scan-2, scan-3" are (a) (left-above) 9.15, 8.99, 8.61 and (b) (right-above) 10.84, 10.66, 10.23. (Different representations have been used to enhance visibility.)
Figure 3
Posterior distribution of the latent variable  for two genes obtained using all three scans (shown in grey) and using only two scans (scan-1 and scan-2, shown in black bars). The observation from "scan-1, scan-2, scan-3" for the genes are (a) (left-above) 10.51, 9.88, 9.08 and (b) (right-above) 11.01, 10.88, 10.50. (Different representations have been used to enhance the visibility.)
Figure 4
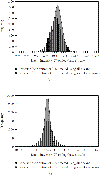
Posterior distribution of true latent intensity for replicated spots on (a) (left-above) the same array A (b) (right-above) different arrays (array  and array
  ). The replicated spots
  and
and  had "scan-1, scan-2, scan-3" measurements as 8.35, 8.26, 8.02 and 8.32, 7.94, 7.76, respectively, on array
  , and spot
  had measurements 9.31, 9.23, 8.97 on array
  and measurements 9.27, 9.17, 8.87 on array
  . (Different representations have been used to enhance visibility.)
Figure 5
This plot demonstrates the relashionship between the estimates of the latent intensities (on natural scale, for data from Cy3 channel) and the measurements from scan-1 over the range [200, 65 535] for 530 spots. The intensities are sorted in an ascending order according to scan-1 reading.
Figure 6
This plot illustrates the dependence of the estimates of the latent intensities on the scan-2 and scan-3 readings in a situation in which the scan-1 readings were saturated. 120 randomly selected genes with scan-1 measurement close to 65 535 are shown by a (nearly) horizontal line. Corresponding measurements from scan-2 and scan-3 are also plotted. The estimates of the latent intensities (posterior median) corresponding to these 120 spots are shown in dots and connected by dotted line. All measurements are on natural scale.
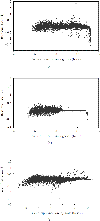
Figure 7
Estimated residuals (= measured values - corresponding posterior median) from the empirical data plotted against the rank of the estimated gene expression for (a) (left-above) scan-1, (b) (middle-above) scan-2, and (c) (right-above) scan-3.
Figure 8
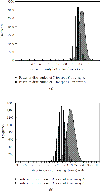
These plots illustrate the sample variability of the posterior distributions, considering (latent) gene expression intensities and in each case 17 simulated samples. The true expression value (on natural scale) is shown with a vertical bar.
Figure 9
Estimated percentage of bias plotted against the spot numbers, based on a simulation experiment.
Figure 10
Comparison of the histograms of the log fold change corresponding to the scan-1 data (shown in grey) and the estimated posterior median (Cy3, Cy5) (shown in black).
Similar articles
- Bayesian hierarchical model for correcting signal saturation in microarrays using pixel intensities.
Gupta R, Auvinen P, Thomas A, Arjas E. Gupta R, et al. Stat Appl Genet Mol Biol. 2006;5:Article20. doi: 10.2202/1544-6115.1220. Epub 2006 Aug 28. Stat Appl Genet Mol Biol. 2006. PMID: 17049031 - Statistical estimation of gene expression using multiple laser scans of microarrays.
Khondoker MR, Glasbey CA, Worton BJ. Khondoker MR, et al. Bioinformatics. 2006 Jan 15;22(2):215-9. doi: 10.1093/bioinformatics/bti790. Epub 2005 Nov 22. Bioinformatics. 2006. PMID: 16303798 - Technical Report on the Modification of 3-Dimensional Non-contact Human Body Laser Scanner for the Measurement of Anthropometric Dimensions: Verification of its Accuracy and Precision.
Jafari Roodbandi AS, Naderi H, Hashenmi-Nejad N, Choobineh A, Baneshi MR, Feyzi V. Jafari Roodbandi AS, et al. J Lasers Med Sci. 2017 Winter;8(1):22-28. doi: 10.15171/jlms.2017.05. Epub 2017 Jan 8. J Lasers Med Sci. 2017. PMID: 28912940 Free PMC article. - Combining multiple laser scans of spotted microarrays by means of a two-way ANOVA model.
Ambroise J, Bearzatto B, Robert A, Macq B, Gala JL. Ambroise J, et al. Stat Appl Genet Mol Biol. 2012 Feb 27;11(3):Article 8. doi: 10.1515/1544-6115.1738. Stat Appl Genet Mol Biol. 2012. PMID: 22499702 - A Bayesian method for analysing spotted microarray data.
Meiklejohn CD, Townsend JP. Meiklejohn CD, et al. Brief Bioinform. 2005 Dec;6(4):318-30. doi: 10.1093/bib/6.4.318. Brief Bioinform. 2005. PMID: 16420731 Review.
Cited by
- Bayesian integrated modeling of expression data: a case study on RhoG.
Gupta R, Greco D, Auvinen P, Arjas E. Gupta R, et al. BMC Bioinformatics. 2010 Jun 1;11:295. doi: 10.1186/1471-2105-11-295. BMC Bioinformatics. 2010. PMID: 20515463 Free PMC article. - Effects of scanning sensitivity and multiple scan algorithms on microarray data quality.
Williams A, Thomson EM. Williams A, et al. BMC Bioinformatics. 2010 Mar 12;11:127. doi: 10.1186/1471-2105-11-127. BMC Bioinformatics. 2010. PMID: 20226031 Free PMC article.
References
- Yang Y, Buckley M, Dudoit S, Speed T. Comparison of methods for image analysis on cDNA microarray data. Journal of Computational and Graphical Statistics. 2001;11(1):108–136.
- Dudley AM, Aach J, Steffen MA, Church GM. Measuring absolute expression with microarrays with a calibrated reference sample and an extended signal intensity range. Proceedings of the National Academy of Sciences of the United States of America. 2002;99(11):7554–7559. doi: 10.1073/pnas.112683499. - DOI - PMC - PubMed
LinkOut - more resources
Full Text Sources
